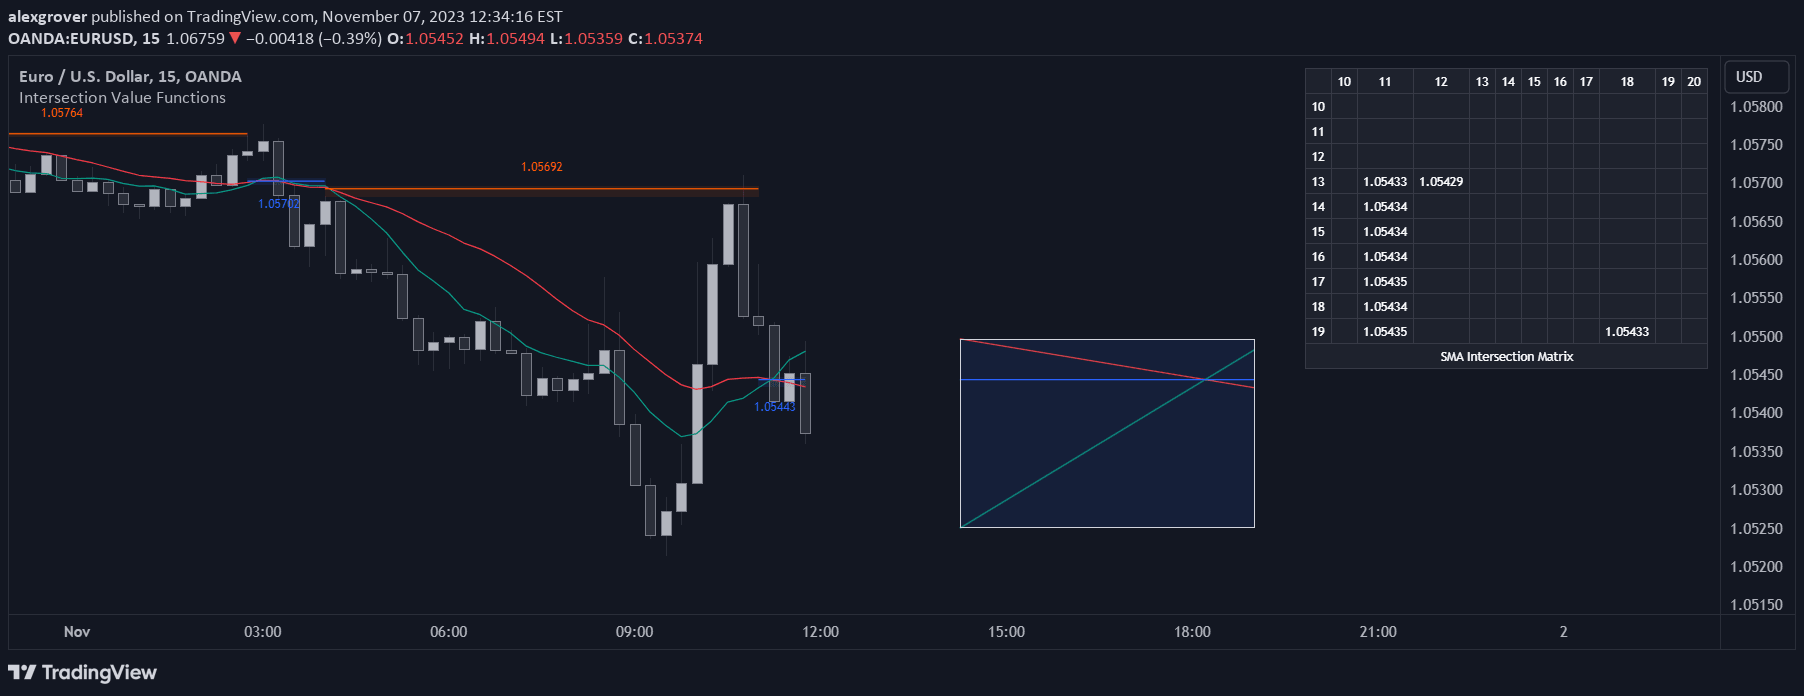
Advanced trading signal that calculates precise intersection points between two data series, offering detailed insights into potential trend changes and crossover events.
Explore complementary indicator rolesHow it works
The signal employs linear interpolation to calculate intersection values between two data series by determining a common scaling factor. It identifies cross events by comparing current and previous values of two different series. The method uses mathematical calculations involving slopes and points to pinpoint exact intersection locations.
By comparing the vertical distances between points, the algorithm computes a scaling factor that reveals where the two series intersect. The approach allows traders to detect precise crossing moments with high accuracy. This technique provides a systematic way to analyze line crossovers in financial data
Why it may be useful
This intersection detection method offers traders a sophisticated tool for identifying trend changes and potential trading signals. By precisely determining crossover points, traders can make more informed decisions about market entry and exit strategies. The technique provides granular insights into momentum shifts and trend transitions that might be missed by traditional indicators.
It allows for detailed analysis of complex price interactions between different moving averages or data series. The mathematical approach reduces subjective interpretation and provides objective crossing points. Such precise crossover detection can enhance overall trading strategy and decision-making
When to explore it
The signal works best in markets with clear trend movements and when analyzing multiple moving averages or related data series. It is particularly effective for traders seeking precise entry and exit points during trend transitions. The method is most useful in moderately volatile markets where clear crossover signals can be detected.
Traders should apply this technique when comparing different timeframe moving averages or when analyzing interactions between price and technical indicators. It provides maximum value when combined with other confirmation signals. The approach is especially powerful for swing traders and day traders monitoring short to medium-term price movements
Keep exploring
What we’ve verified
Access, alerts and repainting behaviour have not been independently verified for this indicator. Check the creator’s current publication and settings.
General descriptions and classifications are recovered research. Verified details above identify the specific checks we have completed. Check the creator’s current publication for later changes.