A visual market analysis tool that uses color-coded boxes to display price changes and RSI across multiple tickers and timeframes, enabling quick multi-asset technical insights.
Explore complementary indicator rolesHow it works
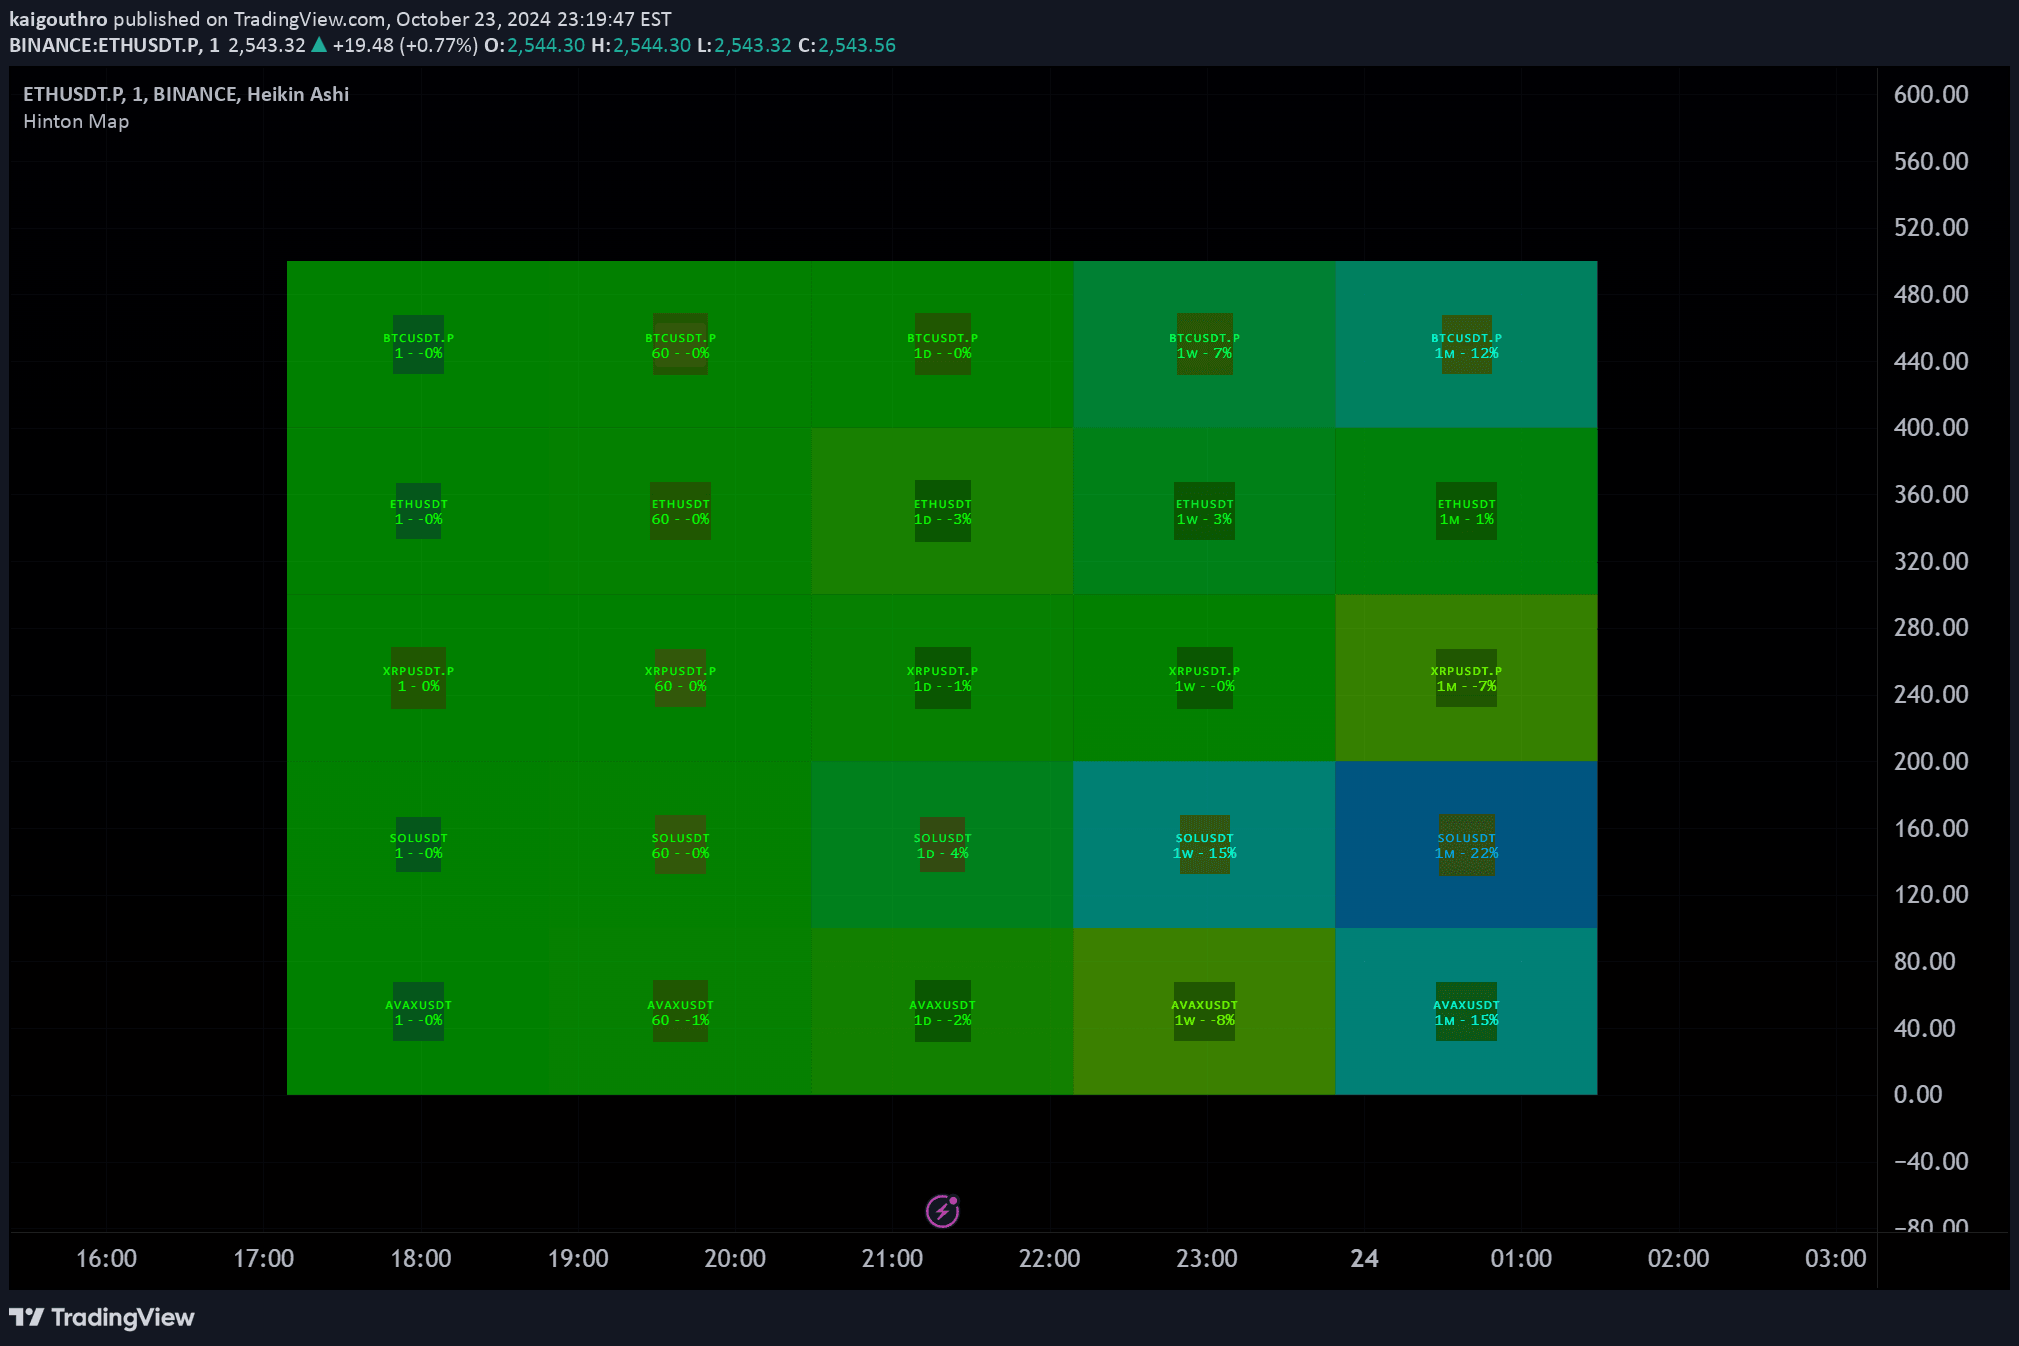
The Hinton Map generates a grid of color-coded boxes representing different financial instruments and timeframes. Each box's size reflects the two-bar percentage price change, with its color indicating the direction and magnitude of that change. The box border width and color represent the RSI deviation from the neutral 50 level, providing a multi-dimensional visual representation of market dynamics.
By mapping multiple tickers simultaneously, the Hinton Map allows traders to quickly assess relative market movements. The visualization uses configurable hue values for negative and positive price changes, enabling customization of the color gradient to suit individual preferences and visual interpretation styles.
Why it may be useful
The Hinton Map transforms complex market data into an intuitive, color-coded visualization that enables rapid market assessment across multiple assets and timeframes. By consolidating price changes and RSI into a single graphic, traders can quickly identify trends, momentum shifts, and potential trading opportunities without extensive manual analysis.
This innovative approach reduces cognitive load by presenting multi-dimensional market information in an easily digestible format. Traders can instantly compare different instruments' performance, detect emerging patterns, and make more informed decisions by leveraging the map's comprehensive yet concise visual representation.
When to explore it
The Hinton Map is most effective during volatile market conditions when tracking multiple assets simultaneously is crucial. It provides maximum value for traders monitoring diverse portfolios across different timeframes, from intraday scalping to longer-term swing trading strategies. The visualization is particularly useful during periods of market transition or when comparing sector-wide performance.
Traders can leverage this tool during news events, earnings seasons, or when analyzing correlations between different financial instruments. Its flexibility in displaying up to five tickers across various timeframes makes it a powerful analytical tool for both short-term and medium-term trading approaches.
Keep exploring
What we’ve verified
Access, alerts and repainting behaviour have not been independently verified for this indicator. Check the creator’s current publication and settings.
General descriptions and classifications are recovered research. Verified details above identify the specific checks we have completed. Check the creator’s current publication for later changes.