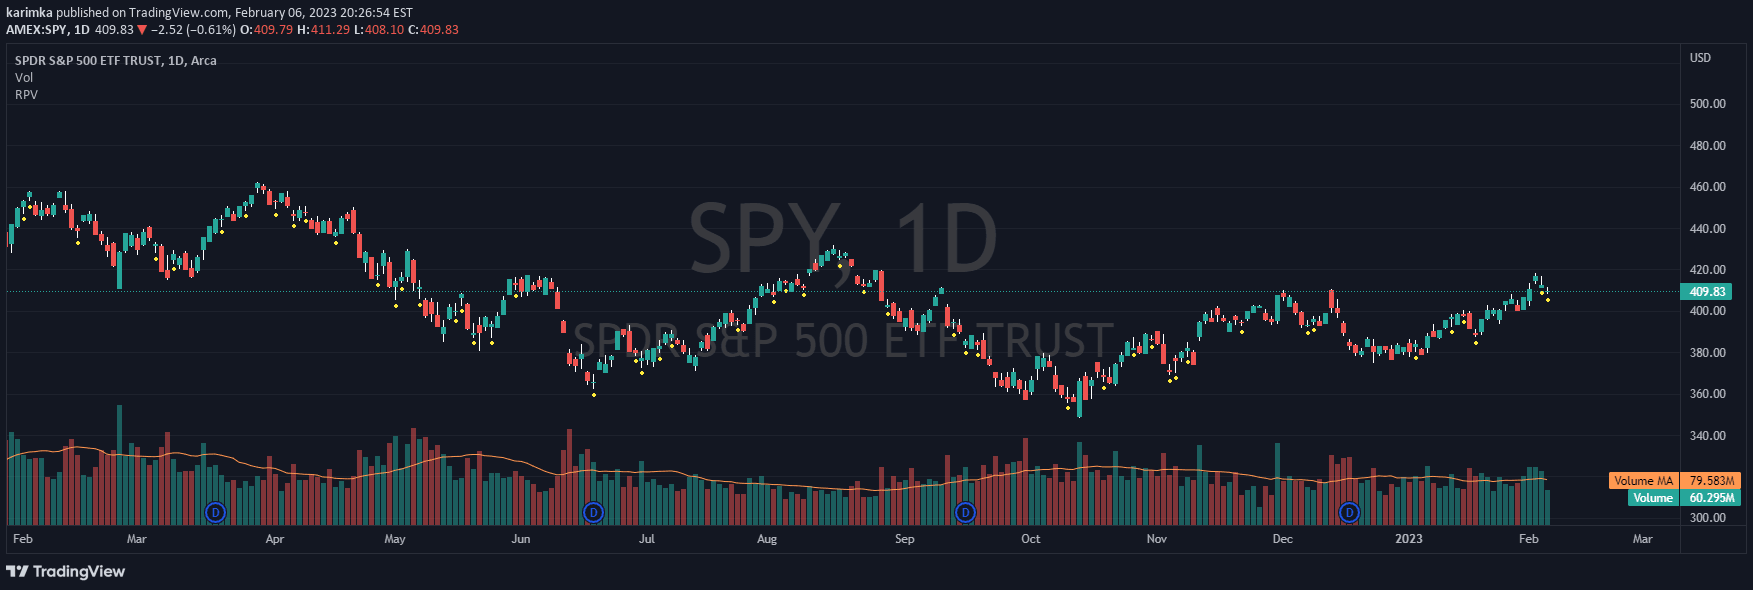
RVOL is a technical indicator comparing current trading volume to average volume, revealing potential market interest and volatility for traders.
Explore complementary indicator rolesHow it works
RVOL calculates the current cumulative trading volume relative to the average historical volume at the same time of day. It compares the current day's volume at a specific time interval against the historical average volume during that same interval across multiple past trading days.
The calculation involves dividing the current cumulative volume by the average cumulative volume for that specific time period. A RVOL value above 1 indicates higher than normal trading activity, while a value below 1 suggests lower than typical volume, providing traders with insights into potential market momentum and interest.
Why it may be useful
RVOL helps traders identify unusual trading activity and potential market movements by highlighting significant volume deviations from historical norms. It provides a real-time indicator of market sentiment, allowing traders to gauge potential trend strength and likelihood of significant price changes.
By understanding relative volume, traders can make more informed decisions about entry and exit points, potential breakouts, and overall market dynamics. This indicator is particularly useful for detecting increased investor interest or potential trend reversals based on volume fluctuations.
When to explore it
RVOL is most effective during intraday trading, particularly for short-term strategies that rely on volume analysis and market momentum. It works best in liquid markets with consistent trading volumes, such as major stock indices, popular stocks, and actively traded securities.
Traders should use RVOL in conjunction with other technical indicators to confirm signals and validate potential trading opportunities. It is especially valuable during market open, around significant news events, and when tracking stocks with known volatility patterns.
Keep exploring
What we’ve verified
Access, alerts and repainting behaviour have not been independently verified for this indicator. Check the creator’s current publication and settings.
General descriptions and classifications are recovered research. Verified details above identify the specific checks we have completed. Check the creator’s current publication for later changes.