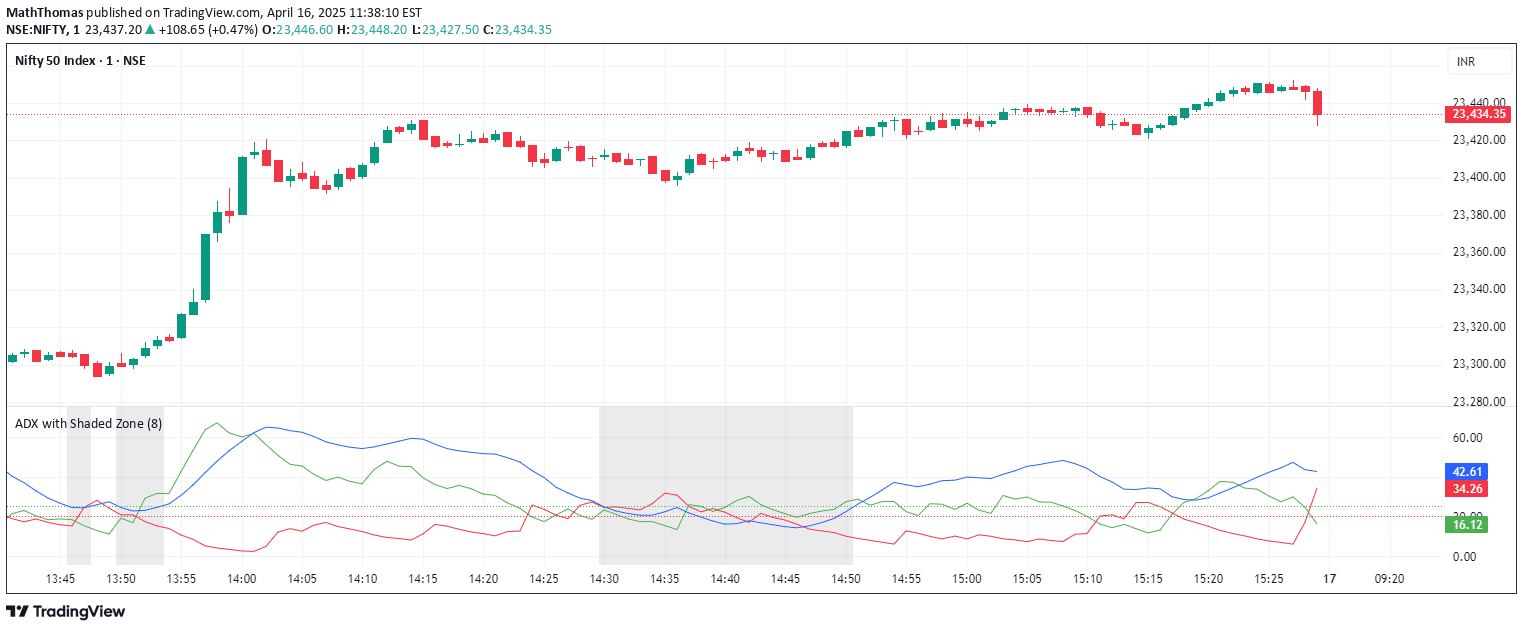
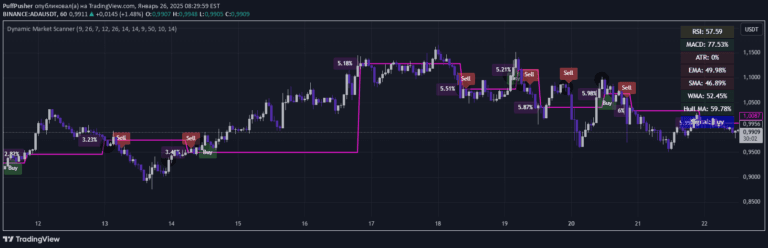
An advanced market analysis indicator that visualizes buyer and seller strength through dynamic lines and moving averages, helping traders identify market pressure and potential trading opportunities.
Explore complementary indicator rolesHow it works
The Pressure Zones indicator operates by simultaneously tracking buyer and seller strength through separate graphical lines, with blue representing buyer power and red representing seller power. These lines are calculated using a base period (default 89) and can be further analyzed using configurable moving averages to smooth out data and reveal underlying trends.
The indicator provides visual representation of market dynamics by showing how buyer and seller forces interact, move, and potentially intersect. Traders can observe whether these forces move in the same or opposite directions, which can signal potential market manipulations, trading opportunities, or periods of market balance.
Why it may be useful
This indicator is crucial because it offers traders a unique perspective on market psychology by quantifying and visualizing the relative strength of buyers and sellers. By revealing hidden market dynamics, traders can gain insights into potential trend reversals, momentum shifts, and areas of potential price manipulation that might not be apparent through traditional price analysis.
The ability to see how buying and selling pressures interact provides traders with an additional layer of market intelligence, helping them make more informed trading decisions by understanding the underlying forces driving price movements.
When to explore it
The Pressure Zones indicator works best in markets with clear trending or ranging characteristics, where buyer and seller forces show distinctive movement patterns. It is particularly effective when used in conjunction with other technical analysis tools to confirm signals and validate potential trading opportunities.
Traders should focus on moments of force intersection, periods where one market force moves in a narrow range while another grows strongly, and instances of divergence between buyer and seller strength. These scenarios can indicate potential market manipulations, breakout opportunities, or significant momentum shifts.
Keep exploring
What we’ve verified
Access, alerts and repainting behaviour have not been independently verified for this indicator. Check the creator’s current publication and settings.
General descriptions and classifications are recovered research. Verified details above identify the specific checks we have completed. Check the creator’s current publication for later changes.