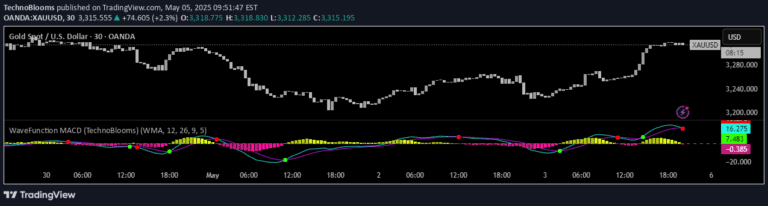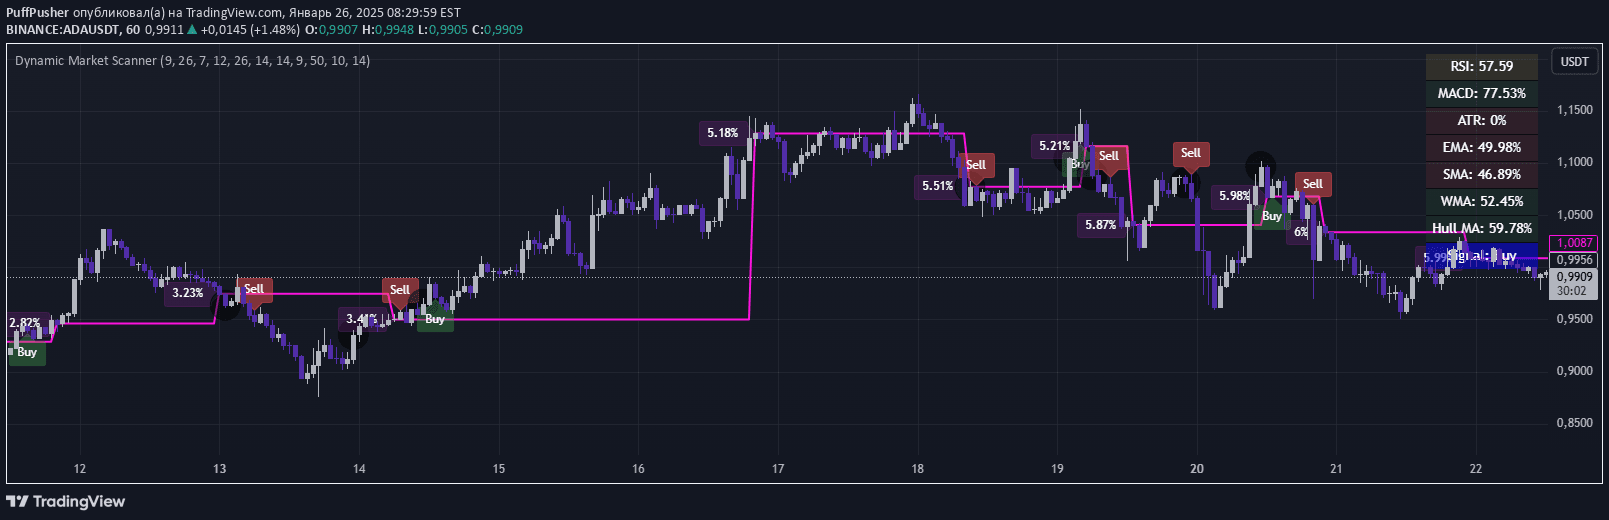
Dynamic Market Scanner is a comprehensive trading tool that analyzes multiple financial indicators to generate buy, sell, and hold signals for precise market assessment.
Explore complementary indicator rolesHow it works
Dynamic Market Scanner integrates multiple technical indicators like MACD, RSI, SMA, EMA, WMA, and Hull MA to generate comprehensive trading signals. Each indicator is analyzed in conjunction with others to determine market direction and potential trade opportunities.
The tool calculates indicator values as percentages relative to their maximum and minimum ranges, providing traders with a nuanced view of current market conditions. By combining different technical analysis tools, the scanner creates a multi-dimensional assessment that goes beyond single-indicator approaches.
Why it may be useful
The Dynamic Market Scanner provides traders with a holistic approach to market analysis, reducing the risk of relying on a single indicator. By integrating multiple technical tools, it offers a more robust and reliable method of identifying potential trading opportunities across different market conditions.
The scanner's comprehensive methodology helps traders make more informed decisions by presenting a detailed overview of market dynamics. Its ability to filter signals and assess volatility gives traders a strategic advantage in understanding market trends and potential entry or exit points.
When to explore it
The Dynamic Market Scanner is most effective in markets with clear trend movements and moderate volatility. Traders can leverage this tool when they need a comprehensive view of market conditions across different timeframes and asset classes.
It is particularly useful during periods of market uncertainty, when traditional single-indicator approaches might provide incomplete or misleading signals. Traders can use this scanner to validate their trading strategies and gain deeper insights into potential market movements.
Keep exploring
What we’ve verified
Access, alerts and repainting behaviour have not been independently verified for this indicator. Check the creator’s current publication and settings.
General descriptions and classifications are recovered research. Verified details above identify the specific checks we have completed. Check the creator’s current publication for later changes.