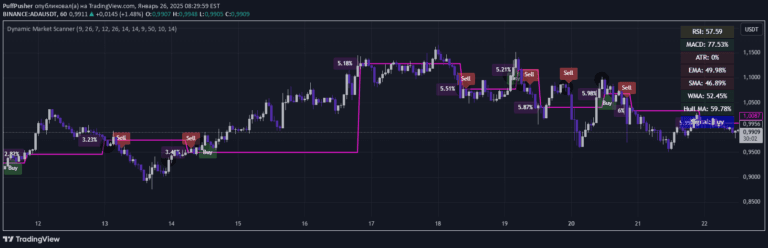
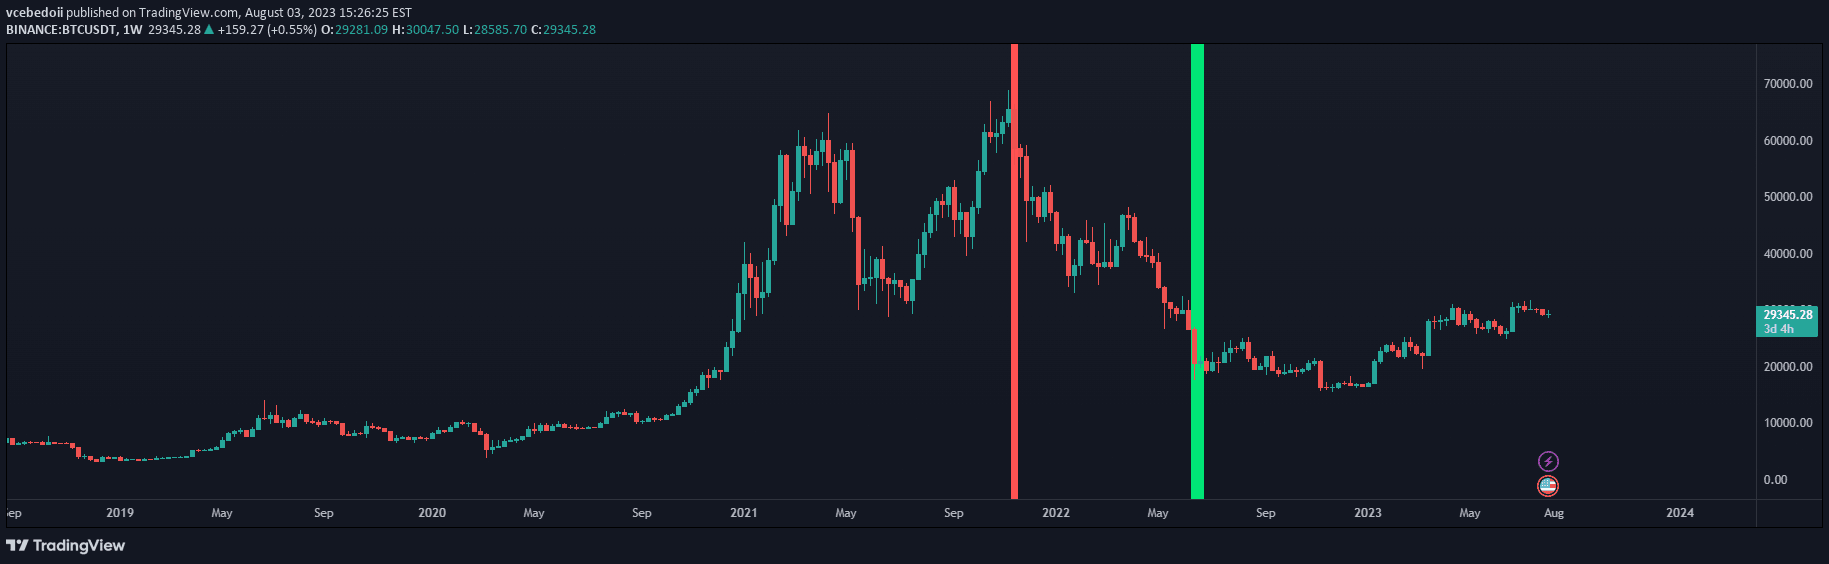
A z-score indicator that measures price deviation from a moving average, generating early trend detection signals based on custom thresholds and lookback periods.
Explore complementary indicator rolesHow it works
The z-score indicator calculates how far the current price deviates from its moving average in standard deviation units. By setting custom thresholds like -1.5 for buy and 3 for sell signals, traders can identify potential trend reversals and early momentum shifts. The script monitors the z-score across multiple datapoints, tracking whether the current z-score indicates a significant price movement compared to recent historical values.
When the z-score drops below a specified threshold, the indicator begins tracking subsequent price movements. If the z-score starts climbing from its low point and exceeds the values of previous datapoints, a buy signal is generated. This approach helps traders detect emerging trends early by measuring price volatility and momentum relative to a baseline moving average.
Why it may be useful
The z-score indicator provides traders with a sophisticated method of understanding price dynamics beyond simple moving average crossovers. By quantifying price deviation in standard deviation units, it offers a more nuanced view of market momentum and potential trend reversals. This approach allows traders to make more informed decisions by identifying statistically significant price movements that might indicate emerging market trends.
Unlike traditional indicators that rely on fixed price levels, the z-score adapts to market volatility, providing a dynamic assessment of price behavior. Its customizable thresholds enable traders to fine-tune the indicator to different market conditions, asset classes, and trading styles, making it a versatile tool for trend identification and early entry strategies.
When to explore it
The z-score indicator works best in markets with clear trending characteristics, such as stocks, commodities, and forex pairs that exhibit consistent directional movements. Weekly timeframes are particularly effective, as they provide a broader perspective on price trends and reduce noise from short-term market fluctuations. Traders should consider using this indicator in markets with moderate volatility, where price movements are substantial enough to generate meaningful signals.
Optimal use includes combining the z-score with other technical analysis tools like support and resistance levels, volume indicators, or momentum oscillators. By integrating multiple confirmation signals, traders can increase the reliability of the z-score's buy and sell recommendations. It is especially useful for traders seeking early trend detection and wanting to capture potential trend reversals before they become widely recognized in the market.
Keep exploring
What we’ve verified
Access, alerts and repainting behaviour have not been independently verified for this indicator. Check the creator’s current publication and settings.
General descriptions and classifications are recovered research. Verified details above identify the specific checks we have completed. Check the creator’s current publication for later changes.