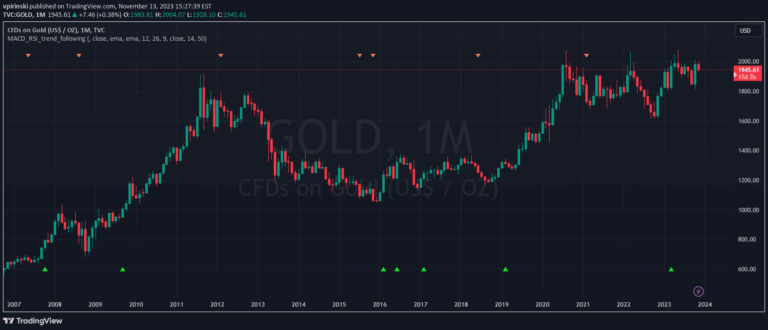
Z Score & Trend Following indicator measures standard deviation from mean, helping traders identify market trends and potential reversal points by analyzing price movement relative to statistical norms.
Explore complementary indicator rolesHow it works
The Z Score & Trend Following indicator calculates the standard deviation of a data point from its mean value using a specified moving average length. It computes the Z score by subtracting the moving average from the source data and dividing by the standard deviation, which reveals how far a data point is from the mean.
The indicator plots the Z score and an inverted Z score, creating visual representations of market deviation. It also generates threshold lines and uses color-coded bars to indicate trend strength and potential market conditions, helping traders quickly interpret market behavior.
Why it may be useful
The Z Score & Trend Following indicator provides traders with a statistical approach to understanding market dynamics by quantifying price movement relative to historical performance. It transforms complex statistical calculations into an intuitive visual representation, allowing traders to quickly assess market trends and potential anomalies.
By combining standard deviation analysis with trend-following characteristics, the indicator offers a sophisticated tool for identifying potential entry and exit points. It helps traders recognize statistical extremes in price movement, which can signal potential trend reversals or continuation patterns.
When to explore it
The Z Score & Trend Following indicator is most effective in markets with clear trending characteristics, where price movements demonstrate consistent directional momentum. It works best in liquid markets with sufficient historical data to calculate meaningful standard deviations, such as major stock indices, forex pairs, and actively traded commodities.
Traders should utilize this indicator during periods of stable market conditions and avoid relying solely on it during extreme market volatility or news-driven price spikes. It is particularly useful when combined with other technical analysis tools to confirm signals and provide a more comprehensive market analysis.
Keep exploring
What we’ve verified
Access, alerts and repainting behaviour have not been independently verified for this indicator. Check the creator’s current publication and settings.
General descriptions and classifications are recovered research. Verified details above identify the specific checks we have completed. Check the creator’s current publication for later changes.