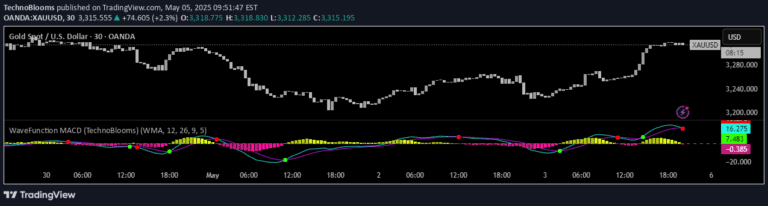
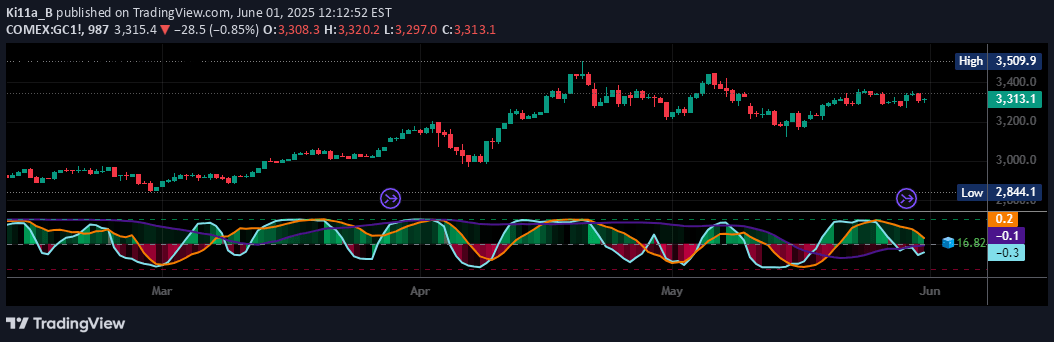
A customizable momentum indicator that analyzes price movement through multiple calculation methods and offers advanced filtering techniques for trend identification and trading signals.
Explore complementary indicator rolesHow it works
The Momentum Madness indicator calculates four different momentum values by comparing current prices with historical prices across multiple periods. It uses customizable length parameters and advanced smoothing techniques like RMA, SMA, and EMA to process these momentum calculations.
The indicator enhances momentum analysis through optional adjustments including volume weighting, RSI integration, MACD consideration, and trend filtering. It smooths the calculated momentum values and generates visual plots representing these momentum measurements, with the ability to dynamically change colors based on trend direction.
Why it may be useful
Momentum indicators are crucial for traders seeking to understand price movement speed and potential trend reversals. They provide insights into market dynamics by measuring the rate of price change and helping traders identify potential entry and exit points.
The Momentum Madness indicator's advanced customization allows traders to adapt the tool to various market conditions and trading styles. By offering multiple calculation methods and optional enhancements, it provides a flexible approach to momentum analysis that can improve trading decision-making.
When to explore it
The Momentum Madness indicator is most effective in markets with clear directional movements and sufficient price volatility. It works best when traders want to assess momentum across multiple timeframes and need a versatile tool for trend identification.
Traders should utilize this indicator during trending market conditions, when price is showing consistent directional movement. It is particularly useful for identifying potential trend changes, momentum shifts, and providing multiple perspective views of price dynamics across different calculation periods.
Keep exploring
What we’ve verified
Access, alerts and repainting behaviour have not been independently verified for this indicator. Check the creator’s current publication and settings.
General descriptions and classifications are recovered research. Verified details above identify the specific checks we have completed. Check the creator’s current publication for later changes.