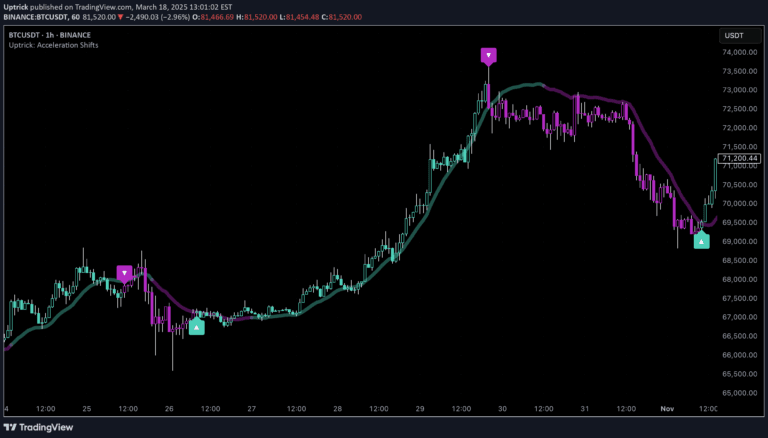
A trading strategy that identifies market momentum by comparing short and long-term moving averages, treating price action like a heartbeat to detect significant market shifts.
Explore complementary indicator rolesHow it works
The Heartbeat Momentum Strategy calculates a short-term and long-term moving average of closing prices, creating a 'market heartbeat' by subtracting the long-term from the short-term average. It measures the heartbeat's volatility using standard deviation over the long-term period.
Signals are generated when the heartbeat deviates significantly from its normal range, specifically when it exceeds or falls below two standard deviations from its mean. The strategy uses visual indicators like blue and red lines for moving averages and green/red triangles to mark buy and sell signals.
Why it may be useful
This strategy provides traders with a unique approach to identifying market momentum by treating price movements like a biological rhythm. It helps traders detect potential trend changes and significant market shifts more dynamically than traditional momentum indicators.
By measuring the difference between short and long-term moving averages and analyzing their deviation, traders can gain insights into market sentiment and potential trend reversals. The method offers a more nuanced view of market dynamics, helping traders make more informed trading decisions.
When to explore it
The Heartbeat Momentum Strategy works best in markets with clear trend movements and moderate volatility. It is particularly effective in capturing momentum shifts in assets that demonstrate consistent price trends across different timeframes.
Traders should consider using this strategy during periods of stable market conditions and avoid it during extreme volatility or ranging markets. It is most reliable when combined with other technical analysis tools and used as part of a comprehensive trading strategy with proper risk management.
Keep exploring
What we’ve verified
Access, alerts and repainting behaviour have not been independently verified for this indicator. Check the creator’s current publication and settings.
General descriptions and classifications are recovered research. Verified details above identify the specific checks we have completed. Check the creator’s current publication for later changes.