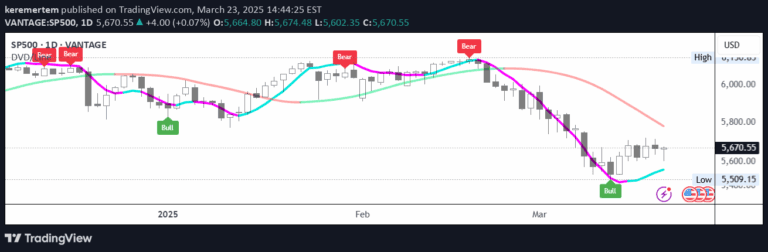
The TICK index measures NYSE stock upticks versus downticks, providing real-time market sentiment insights and potential trend reversal signals through divergence analysis.
Explore complementary indicator rolesHow it works
The TICK index tracks the number of NYSE stocks making an uptick versus a downtick, creating a real-time measure of market sentiment and buying/selling pressure. By comparing the current TICK reading against reference levels like +500 or -1000, traders can identify potential market momentum shifts and interpret underlying trading dynamics.
The indicator calculates divergences between price action and TICK readings, highlighting potential trend reversals when price movements do not align with the TICK index's momentum. Traders can customize smoothing factors and lookback periods to fine-tune the signal's sensitivity and responsiveness to market conditions.
Why it may be useful
The TICK index provides traders with an immediate pulse of market sentiment, offering insights into buying and selling pressure that extend beyond individual stock movements. By revealing collective market behavior, traders can make more informed decisions about potential trend reversals and market dynamics.
Understanding TICK readings helps traders assess overall market strength, identify potential exhaustion points, and validate trading signals from other technical indicators. The real-time nature of the TICK index makes it particularly valuable for short-term traders seeking to capture quick market movements.
When to explore it
The TICK index works best during active market hours with significant trading volume, particularly when combined with other technical analysis tools and confirmation signals. Traders should focus on extreme readings at +1000 or -1000, which indicate strong buying or selling pressure and potential market turning points.
Optimal usage occurs when traders integrate TICK analysis with support/resistance levels, market trend direction, and multiple timeframe confirmations. The indicator is most effective during regular market hours (9:30 AM - 4:00 PM ET) and when avoiding periods of low volume or major pending news events.
Keep exploring
What we’ve verified
Access, alerts and repainting behaviour have not been independently verified for this indicator. Check the creator’s current publication and settings.
General descriptions and classifications are recovered research. Verified details above identify the specific checks we have completed. Check the creator’s current publication for later changes.