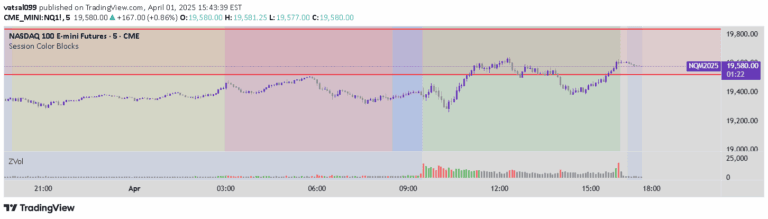
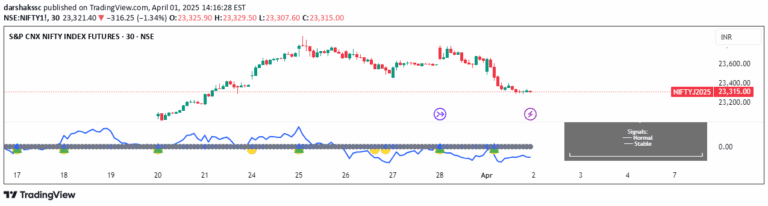
A trading signal that maps session price dynamics across regular and extended trading hours, identifying critical market thresholds and potential institutional activity zones.
Explore complementary indicator rolesHow it works
The signal operates by tracking price ranges across Regular Trading Hours (RTH) and Extended Trading Hours (ETH), creating a comprehensive view of market boundaries. It systematically identifies session highs, lows, and critical 50% levels where significant market reactions typically occur.
By analyzing these price thresholds, the signal generates visual representations of potential liquidity zones and institutional positioning. It meticulously maps key price levels, enabling traders to understand market dynamics at session transitions and detect potential breakout opportunities beyond previous session extremes.
Why it may be useful
This signal provides traders with a sophisticated tool for understanding complex market microstructure and institutional trading behavior. By exposing potential liquidity raids and highlighting critical price thresholds, it offers insights into where smart money might be positioning itself.
The signal's ability to reveal divergences between RTH and ETH behavior gives traders a strategic advantage in anticipating potential directional moves. It transforms abstract market information into actionable intelligence, helping traders make more informed decisions by providing objective entry and exit parameters.
When to explore it
The signal is most effective during periods of market transition, particularly around session boundaries where institutional positioning tends to shift. It works exceptionally well in volatile markets with significant price movement and during times of potential liquidity concentration.
Traders should utilize this signal when seeking to understand underlying market dynamics beyond surface-level price action. It is particularly valuable for those interested in detecting potential breakouts, measuring session volatility differences, and identifying critical price levels where institutional activity is likely to be concentrated.
Keep exploring
What we’ve verified
Access, alerts and repainting behaviour have not been independently verified for this indicator. Check the creator’s current publication and settings.
General descriptions and classifications are recovered research. Verified details above identify the specific checks we have completed. Check the creator’s current publication for later changes.