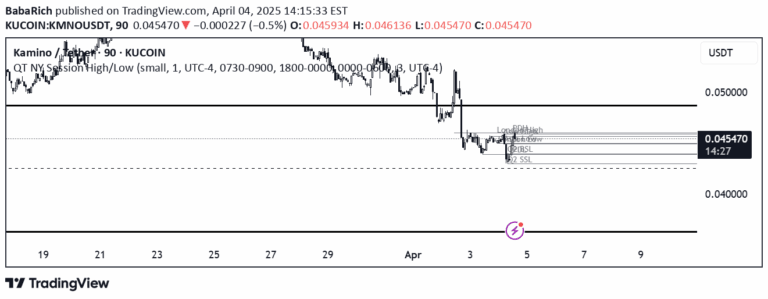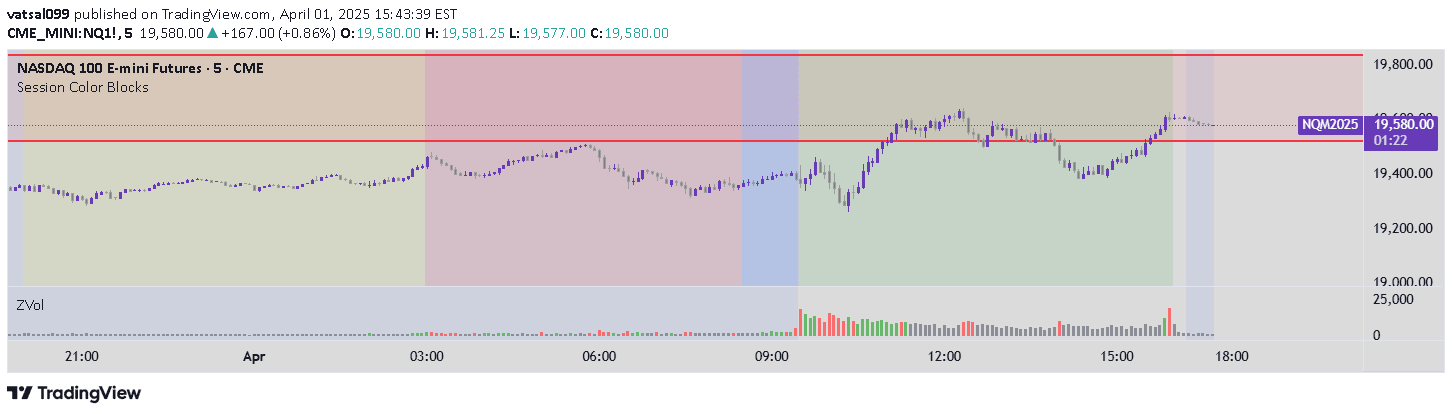
A trading tool that visually highlights different global market trading sessions using color-coded background blocks, helping traders understand market timing and context across Asia, London, Premarket, and New York sessions.
Explore complementary indicator rolesHow it works
The market session indicator automatically segments trading hours into distinct color-coded blocks based on predefined time zones. It uses the America/New_York timezone to accurately track session times, ensuring precise demarcation between Asia, London, Premarket, and New York sessions.
Each session is represented by a unique color: yellow for Asia, red for London, blue for Premarket, and green for New York. The system dynamically adjusts for daylight savings time, maintaining accuracy throughout the year. Sessions are mutually exclusive, preventing overlapping blocks and providing clear visual separation of trading periods
Why it may be useful
Understanding global market sessions helps traders make more informed decisions by providing context about market activity and potential liquidity. Different sessions have unique characteristics in terms of volatility, volume, and trading dynamics.
By visualizing these sessions, traders can better anticipate potential market movements, plan entry and exit strategies, and align their trading approach with the most active market periods. The color-coded representation makes it easy to quickly recognize which session is currently active and understand the broader market context
When to explore it
This indicator is most valuable for traders focusing on US stocks, futures, and global markets that are influenced by different trading sessions. It is particularly useful during transition periods between sessions when market behavior can shift significantly.
Traders can benefit from this tool when planning trades, understanding potential liquidity changes, and aligning their strategies with the most active market hours. It helps both day traders and swing traders by providing a clear visual representation of global market dynamics
Keep exploring
What we’ve verified
Access, alerts and repainting behaviour have not been independently verified for this indicator. Check the creator’s current publication and settings.
General descriptions and classifications are recovered research. Verified details above identify the specific checks we have completed. Check the creator’s current publication for later changes.