
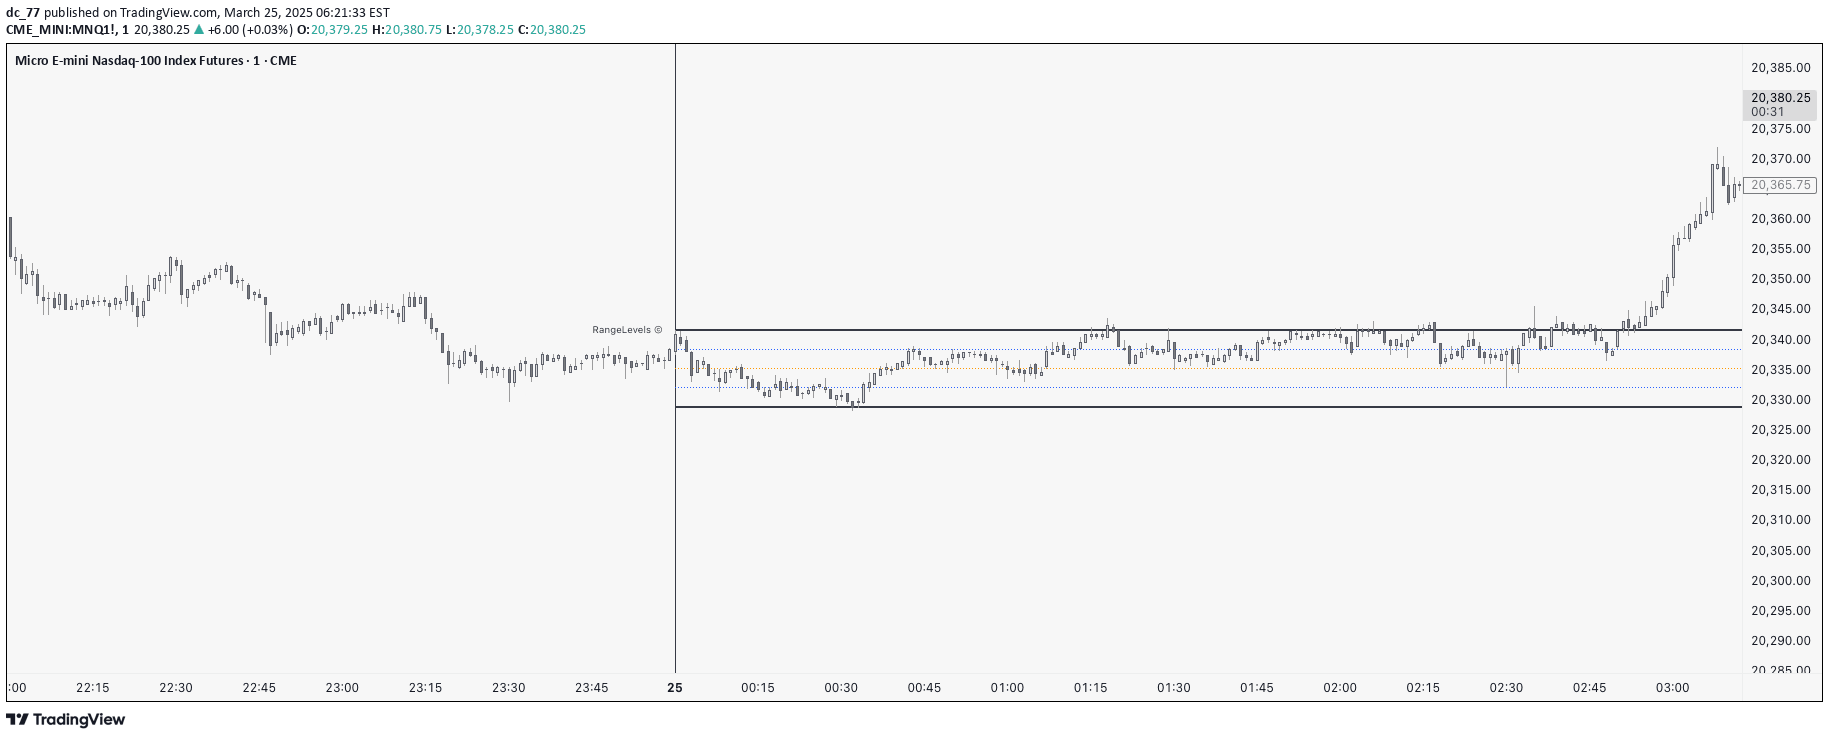
SessionRangeLevels is a Pine Script indicator that dynamically plots key price levels based on a custom trading session, helping traders identify support, resistance, and potential breakout zones.
Explore complementary indicator rolesHow it works
The indicator first defines a specific trading session based on user-selected time and time zone. During this session, it continuously tracks the highest high and lowest low prices. It then calculates and plots five key price levels: high, 75%, 50% (EQ), 25%, and low.
These levels are projected forward on the chart as horizontal lines with customizable styles, colors, and widths. The indicator updates these levels dynamically as new price extremes are established within the session, providing real-time visual reference points for traders
Why it may be useful
SessionRangeLevels offers traders a systematic approach to understanding price dynamics within specific time windows. By identifying key session-based price levels, traders can gain insights into potential support and resistance zones.
The indicator helps visualize price structure, momentum, and potential breakout points. It provides a structured framework for analyzing market behavior during critical trading periods. Traders can use these levels to make more informed decisions about entry, exit, and risk management strategies
When to explore it
This indicator is most effective for traders focusing on session-based strategies, such as trading during market opens like London or New York sessions. It works best on shorter timeframes like 1-minute or 5-minute charts that capture intraday price movements.
Traders can utilize it across various markets including forex, stocks, and futures. It is particularly useful during periods of high market activity and potential volatility. The tool helps identify key price levels for setting targets, stop-losses, and understanding potential market sentiment shifts
Keep exploring
What we’ve verified
Access, alerts and repainting behaviour have not been independently verified for this indicator. Check the creator’s current publication and settings.
General descriptions and classifications are recovered research. Verified details above identify the specific checks we have completed. Check the creator’s current publication for later changes.


