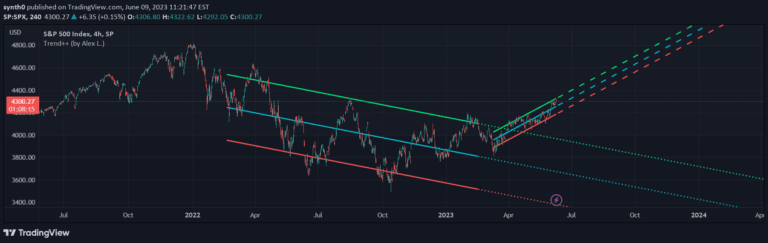
Trendline Pivots [QuantVue]
Trendline Pivot Indicator automatically draws and recognizes dynamic trend lines connecting pivot highs and lows, providing visual support and resistance reference points on price charts.
Explore 11,183 indicators. Filter beyond the obvious.
Discover the tools that fit the way you trade.
11,183 tools to explore
Trendline Pivot Indicator automatically draws and recognizes dynamic trend lines connecting pivot highs and lows, providing visual support and resistance reference points on price charts.
A trend channel indicator that identifies short-term and long-term market trends, allowing traders to pinpoint potential entry and exit points based on trend line positioning.
False Breakout is a technical analysis method identifying price movements that momentarily break key levels but quickly reverse, offering strategic trading opportunities.
K's Pivot Points are a technical analysis tool that identifies potential support and resistance levels by calculating pivot points from previous price action over 24-hour periods.
A flexible Fibonacci extension indicator that allows customizable time zone reference and multiplier settings for precise price projection and analysis across different trading instruments.
Pivot Data Indicator identifies key price pivot points by analyzing chart highs and lows, helping traders recognize potential trend reversals and key support/resistance levels.
A comprehensive technical analysis tool combining support/resistance levels, trend lines, and moving averages to identify market dynamics and potential trading opportunities.
A trend identification script that uses pivot high and low points to visually highlight market trend dynamics through color-coded lines indicating higher and lower price movements.
A powerful trading indicator that identifies market conditions and potential breakout opportunities using Camarilla pivots, helping traders recognize trend formations and key support/resistance levels.
A dynamic indicator that calculates percentage-based support and resistance levels between recent swing highs and lows, helping traders identify potential price reaction zones.
A trading signal that maps session price dynamics across regular and extended trading hours, identifying critical market thresholds and potential institutional activity zones.
Likes, views, and comments are historical TradingView snapshots. They describe attention, not trading performance.