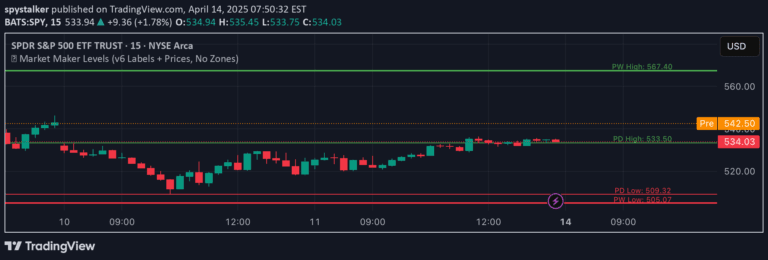
Pivot Data Indicator identifies key price pivot points by analyzing chart highs and lows, helping traders recognize potential trend reversals and key support/resistance levels.
Explore complementary indicator rolesHow it works
The Pivot Data Indicator identifies pivot points by analyzing price charts for significant local highs and lows. It defines a pivot high as a point where no bars have higher prices for a specified number of bars before and after, and a pivot low similarly identifies points with no lower bars in the surrounding period.
Traders can adjust the 'Pivot Lookback Bars' setting to customize how many bars are used to determine these pivot points. The indicator then marks these pivots and calculates various statistics such as the average price percentage and the number of bars between pivots, providing a comprehensive view of price movement patterns.
Why it may be useful
Pivot points are crucial for understanding market dynamics and potential trend changes. By systematically identifying and analyzing these key price levels, traders can gain insights into market sentiment and potential future price movements.
The indicator helps traders visualize market structure, recognize potential support and resistance levels, and develop more informed trading strategies. It transforms complex price data into clear, actionable visual information that can help predict potential trend reversals or continuations.
When to explore it
The Pivot Data Indicator is most effective in markets with clear trending or ranging characteristics. It works well in various timeframes, from short-term scalping to longer-term swing trading, making it versatile for different trading styles and strategies.
Traders should use this indicator when seeking to identify key market turning points, understand price momentum, and develop precise entry and exit strategies. It is particularly useful during periods of market transition, helping traders recognize potential breakouts or trend reversals before they fully develop.
Keep exploring
What we’ve verified
Access, alerts and repainting behaviour have not been independently verified for this indicator. Check the creator’s current publication and settings.
General descriptions and classifications are recovered research. Verified details above identify the specific checks we have completed. Check the creator’s current publication for later changes.