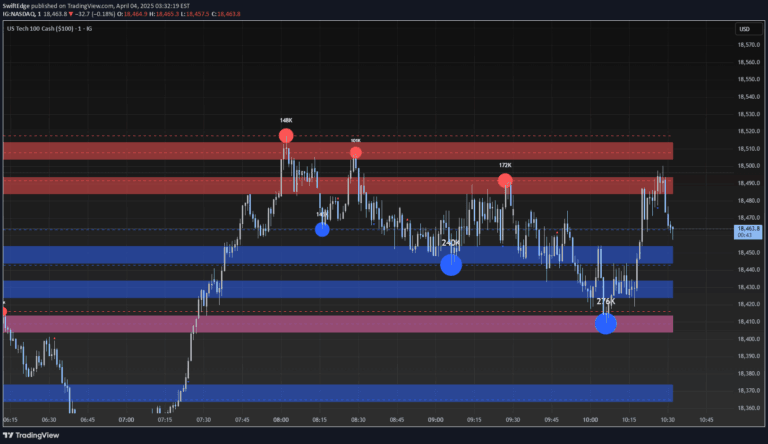
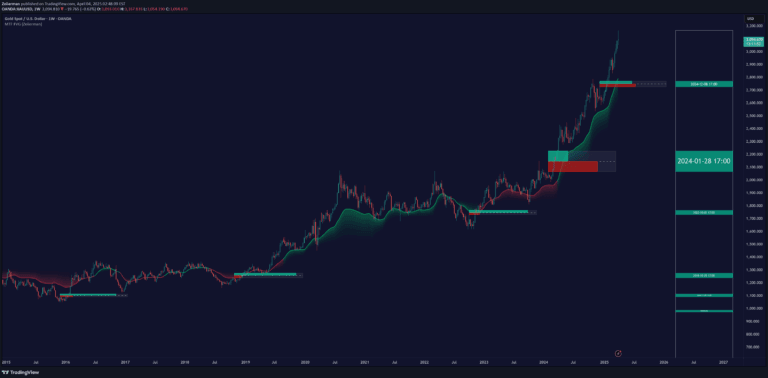
A dynamic indicator that calculates percentage-based support and resistance levels between recent swing highs and lows, helping traders identify potential price reaction zones.
Explore complementary indicator rolesHow it works
The Swing High/Low Percentile Indicator first identifies the most recent significant swing high and low price points in the market. It then calculates the price range between these points and divides this range into three percentage-based levels: 25%, 50%, and 75%.
These percentile lines are dynamically plotted on the chart, creating fluid support and resistance zones that adapt to current market conditions. As new swing highs and lows are formed, the indicator automatically recalculates and updates these levels, providing traders with a responsive view of potential price interaction points.
Why it may be useful
This indicator provides traders with a sophisticated yet straightforward method of understanding market dynamics and potential price movements. By creating percentage-based levels between swing points, it offers a more nuanced approach to identifying support and resistance compared to traditional static methods.
The dynamic nature of the percentile lines allows traders to quickly assess market trends, potential entry and exit points, and overall price momentum. It transforms complex price action into easily interpretable visual zones, helping traders make more informed decisions about market direction and potential trading opportunities.
When to explore it
The Swing High/Low Percentile Indicator is most effective in markets with clear trending or consolidating behavior. It works exceptionally well in timeframes ranging from short-term scalping to longer-term swing trading, providing valuable insights across different trading styles.
Traders should pay special attention to the indicator during periods of price transition, such as when the market is moving between trending and ranging conditions. It is particularly useful when combined with other technical analysis tools, helping to confirm potential trade setups and providing an additional layer of market analysis.
Keep exploring
What we’ve verified
Access, alerts and repainting behaviour have not been independently verified for this indicator. Check the creator’s current publication and settings.
General descriptions and classifications are recovered research. Verified details above identify the specific checks we have completed. Check the creator’s current publication for later changes.