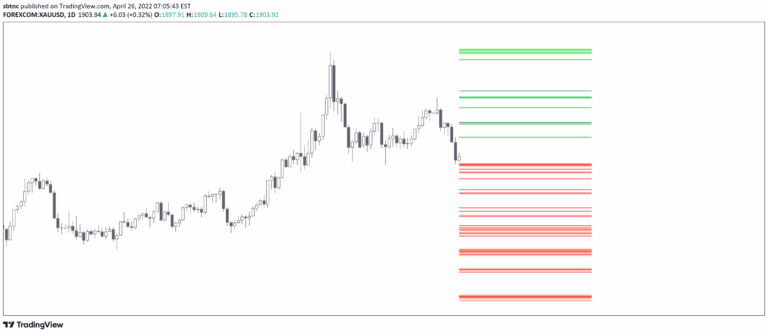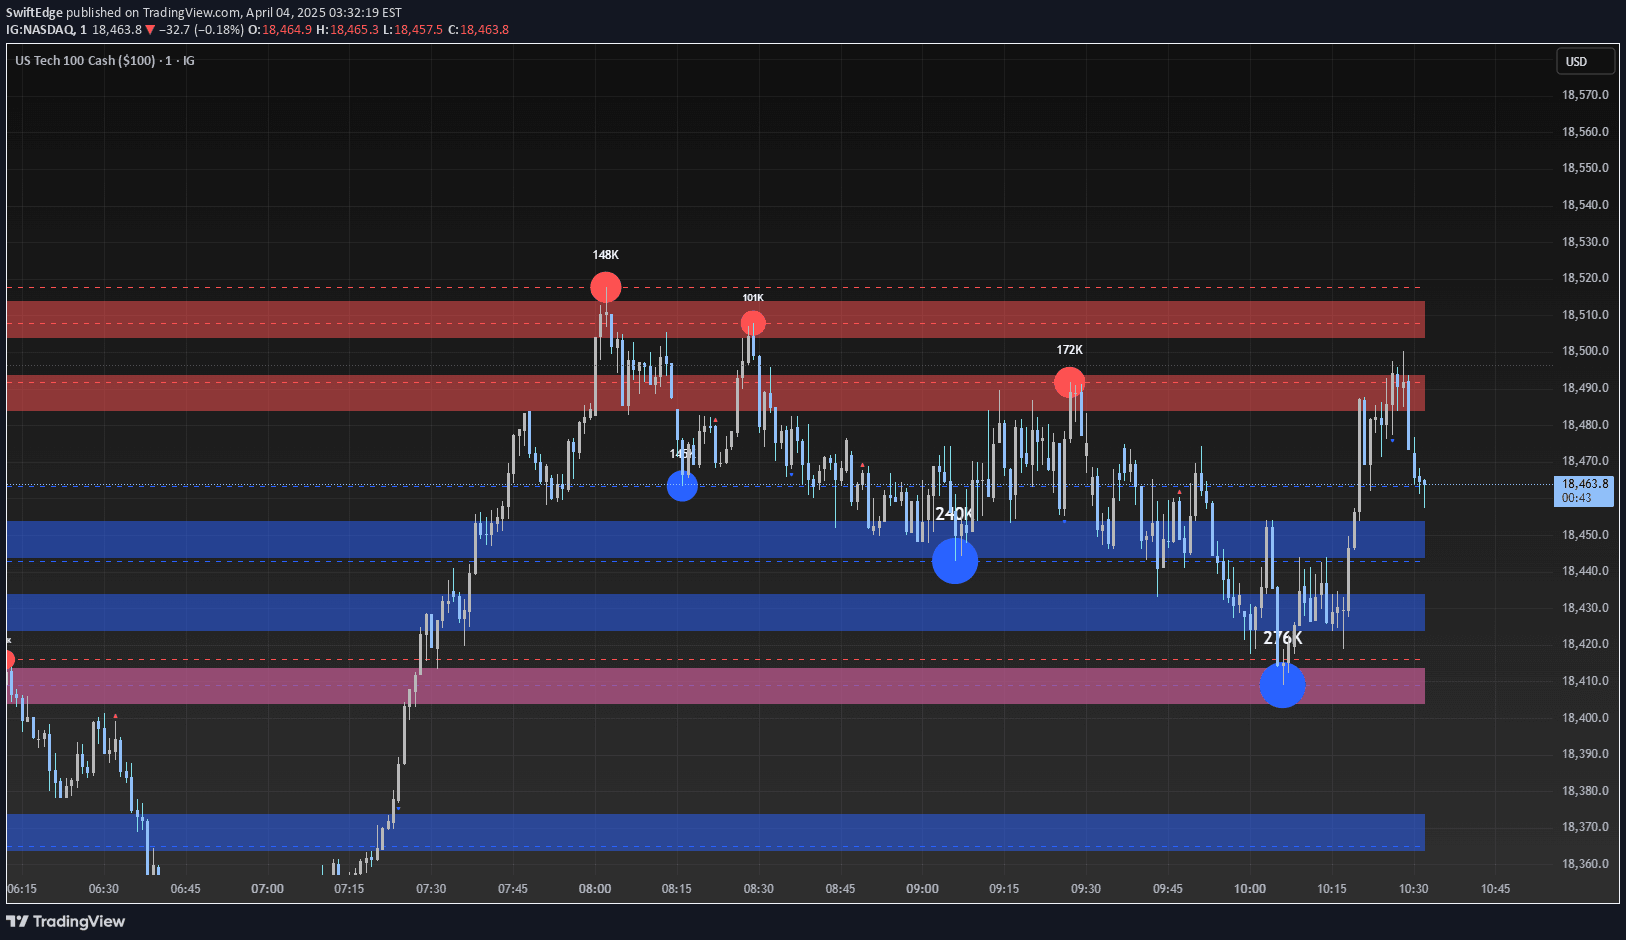
A liquidity visualization tool that maps buy and sell-side zones using swing highs/lows and volume analysis, providing traders a color-coded heatmap of potential support and resistance levels.
Explore complementary indicator rolesHow it works
The indicator uses ta.pivothigh and ta.pivotlow functions to identify swing highs and lows over a specified lookback period. It captures volume data at these points and averages them using a volume multiplier.
The script then divides the price range into user-defined bins, creating a heatmap with blue zones representing buy-side liquidity below current price and red zones showing sell-side liquidity above current price. Each zone is labeled with a bubble indicating estimated liquidity amount based on volume analysis
Why it may be useful
This tool bridges price action, market activity, and visual clarity by providing a comprehensive view of potential liquidity zones. Traders can quickly identify where significant buying or selling pressure might exist, which often coincides with stop-loss clusters or pending orders.
The color-coded heatmap and volume-derived bubbles help traders understand the strength and location of potential support and resistance levels more intuitively than traditional static indicators
When to explore it
The liquidity heatmap works best in markets with clear volume patterns and identifiable swing points. It is particularly useful for day traders and swing traders analyzing short to medium-term price movements.
Traders should use it alongside other technical analysis tools to confirm potential entry and exit points. The indicator is most effective on timeframes from 1-minute to daily charts, and performs well in liquid markets like forex, stocks, and cryptocurrencies
Keep exploring
What we’ve verified
Access, alerts and repainting behaviour have not been independently verified for this indicator. Check the creator’s current publication and settings.
General descriptions and classifications are recovered research. Verified details above identify the specific checks we have completed. Check the creator’s current publication for later changes.