
YOUR INDICATOR RESEARCH STARTS HERE

Find the right indicator.
Understand what it does.

Explore 11,183 indicators. Filter beyond the obvious.
Discover the tools that fit the way you trade.

THE INDICATOR LIBRARY

Results for “timeframe”

11,183 tools to explore

2,174 indicators matching your filters
Save search
VolumeEditor’s pick

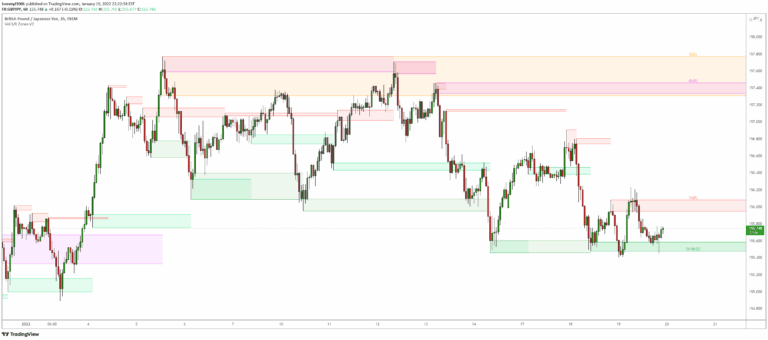
Volume-based Support & Resistance Zones

by tommyf1001

An advanced Support & Resistance indicator that identifies significant price zones using volume and fractal highs/lows, helping traders visualize potential trend reversals and continuations.

Main price chart · unverifiedDay Trading · Swing Trading
Explore
17.9Klikes654.3Kviews459comments

Save
VolumeEditor’s pick

Volume Profile / Fixed Range

by LonesomeTheBlue

A Volume Profile indicator that calculates trading volumes within a fixed range, helping traders understand volume distribution and identifying key price levels with visual representation.

Main price chart · unverifiedDay Trading · Swing Trading
Explore
13.4Klikes576.6Kviews171comments
Save
TrendMomentumEditor’s pick

Linear Regression Oscillator [ChartPrime]

by ChartPrime

A custom indicator using linear regression to analyze closing prices, helping traders identify market trends, mean reversion, and potential overbought or oversold conditions across different timeframes.

Separate pane · unverifiedDay Trading · Swing Trading
Explore
10.5Klikes214.9Kviews76comments
Save
LevelsSignalTrend

ICT Silver Bullet [LuxAlgo]

by LuxAlgo

An advanced trading indicator that identifies potential Fair Value Gaps during specific one-hour market sessions and highlights support/resistance levels for strategic entry and exit points.

Main price chart · unverifiedScalping · Day Trading
Explore
10.1Klikes354.3Kviews125comments
Save
VolumeTrendEditor’s pick

Mxwll Price Action Suite [Mxwll]

by MXWLL-Capital-Trading

Advanced trading indicator providing comprehensive market structure analysis with customizable sensitivities, identifying price action patterns, order blocks, and session dynamics for strategic trading decisions.

Main price chart · unverifiedDay Trading · Swing Trading
Explore
9.4Klikes248.9Kviews177comments
Save
TrendVolatilityEditor’s pick

Support Resistance MTF

by LonesomeTheBlue

A multi-timeframe support and resistance indicator that helps traders identify key price levels by analyzing market data across different time frames and customizable settings.

Main price chart · unverifiedDay Trading · Swing Trading
Explore
8.9Klikes368.4Kviews103comments
Save
TrendEditor’s pick

[SK] Fibonacci Auto Trend Scouter

by sirkriz

FATS is an advanced trading indicator that automatically draws trend lines, Fibonacci levels, and trend sights across multiple timeframes to help traders identify market direction and potential support/resistance zones.

Main price chart · unverifiedDay Trading · Swing Trading
Explore
8.5Klikes249.7Kviews153comments
Save
LevelsSignalTrend

Hourly Trading System (Zeiierman)

by Zeiierman

A comprehensive hourly trading system that plots key price levels, identifies trend direction, and highlights potential entry and exit points across different timeframes.

Main price chart · unverifiedScalping · Day Trading
Explore
7.4Klikes100.1Kviews69comments
Save
LevelsSignalTrend

Ghost Tangent Crossings [ChartPrime]

by ChartPrime

Ghost Tangent Crossings is an innovative pivot point indicator that visualizes market movements using ellipses, dynamically tracking zig-zag patterns and potential price breakouts.

Main price chart · unverifiedScalping · Day Trading
Explore
7.3Klikes115.5Kviews73comments
Save
MomentumOscillatorTrend

Market Sentiment Technicals [LuxAlgo]

by LuxAlgo

A comprehensive market sentiment indicator that synthesizes multiple technical analysis techniques into a single value, providing insights into market direction, momentum, and potential trend reversals.

Separate pane · unverifiedScalping · Day Trading
Explore
6.9Klikes128.8Kviews43comments
Save

Likes, views, and comments are historical TradingView snapshots. They describe attention, not trading performance.

START WITH A QUESTION

A little less searching.
A lot more understanding.

Tell DeepAlpha what you need. Get an explanation, a shortlist,
and a direct path to the indicators behind it.

Ask DeepAlpha

