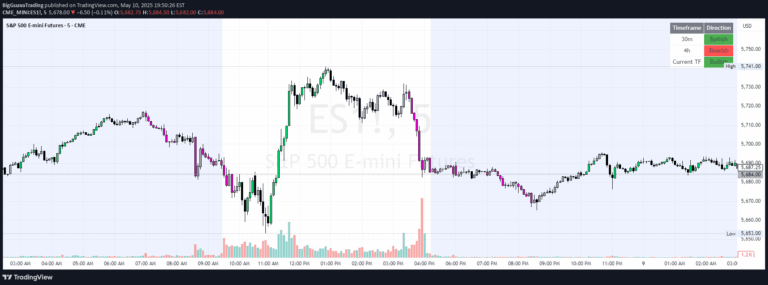
A multi-timeframe candle analysis tool that provides rapid insights into market conditions by calculating candle types, volatility, and strength across six customizable timeframes.
Explore complementary indicator rolesHow it works
The Multi-Timeframe Candle Analysis script systematically evaluates price movements across six user-defined timeframes, ranging from intraday to weekly intervals. It extracts critical price data including open, high, low, and close values for current and previous candles, then computes specific metrics about each candle's characteristics.
By analyzing these metrics, the script determines candle type (bullish or bearish), calculates volatility percentage change, and evaluates candle strength relative to previous periods. The results are dynamically presented in a color-coded table that allows traders to quickly understand market conditions without switching between multiple charts.
Why it may be useful
This tool addresses a critical challenge in trading by consolidating complex multi-timeframe analysis into a single, easily digestible interface. Traders often struggle to maintain situational awareness across different timeframes, which can lead to missed opportunities or poorly timed trades.
By providing a comprehensive overview of market conditions, the script empowers traders to make more informed decisions quickly. The color-coded visual representation helps traders rapidly interpret market dynamics, reducing cognitive load and enabling faster, more confident trading responses.
When to explore it
The Multi-Timeframe Candle Analysis is most effective during periods of active market movement, particularly for traders focused on short-term price fluctuations. It is especially valuable in volatile markets where understanding rapid price changes across multiple timeframes can provide a significant competitive advantage.
Traders should utilize this tool during high-liquidity trading sessions, such as major market opens or during significant economic announcements. It is particularly useful for scalpers and day traders who require quick, comprehensive market insights to make rapid trading decisions.
Keep exploring
What we’ve verified
Access, alerts and repainting behaviour have not been independently verified for this indicator. Check the creator’s current publication and settings.
General descriptions and classifications are recovered research. Verified details above identify the specific checks we have completed. Check the creator’s current publication for later changes.