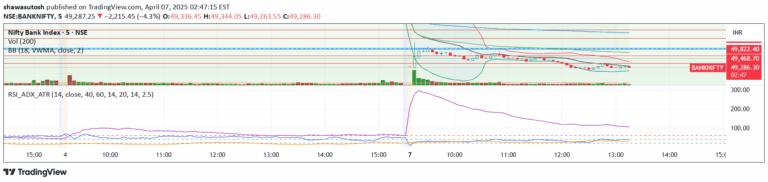
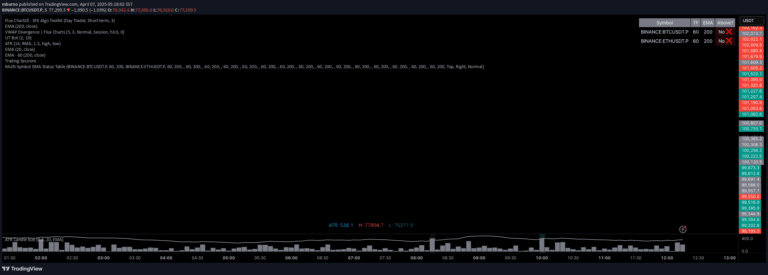
A comprehensive multi-timeframe indicator that consolidates trend, volatility, and candlestick pattern information into a single table for quick market analysis and decision-making.
Explore complementary indicator rolesHow it works
The Multi-Timeframe Trend Table operates by analyzing multiple timeframes simultaneously using key technical indicators and metrics. It calculates trends through simple moving averages, determining whether each timeframe exhibits an upward, downward, or neutral trend direction.
The indicator further enhances its analysis by incorporating volatility measurements using Average True Range (ATR), rating market volatility from 1 to 10. It also tracks Volume Weighted Average Price (VWAP) and identifies specific candlestick patterns like Doji, Hammer, and Engulfing patterns to provide a comprehensive market overview.
Why it may be useful
The indicator is crucial because it simplifies complex market analysis by consolidating multiple technical metrics into a single, easy-to-read format. Traders can quickly assess market conditions across different timeframes without manually switching between multiple charts and indicators.
By providing insights into trends, volatility, volume, and candlestick patterns, the tool helps traders make more informed and strategic decisions. It reduces analysis complexity and enables faster recognition of potential trading opportunities by presenting a holistic view of market dynamics.
When to explore it
The Multi-Timeframe Trend Table is most effective when traders need a comprehensive, rapid market assessment across multiple timeframes. It works exceptionally well during periods of market transition, where understanding trend changes, volatility shifts, and potential momentum reversals is critical.
Traders can leverage this indicator during both trending and consolidating market conditions, using its detailed insights to identify potential entry and exit points. It is particularly valuable for traders who manage multiple instruments and require a quick, synthesized view of market conditions.
Keep exploring
What we’ve verified
Access, alerts and repainting behaviour have not been independently verified for this indicator. Check the creator’s current publication and settings.
General descriptions and classifications are recovered research. Verified details above identify the specific checks we have completed. Check the creator’s current publication for later changes.