
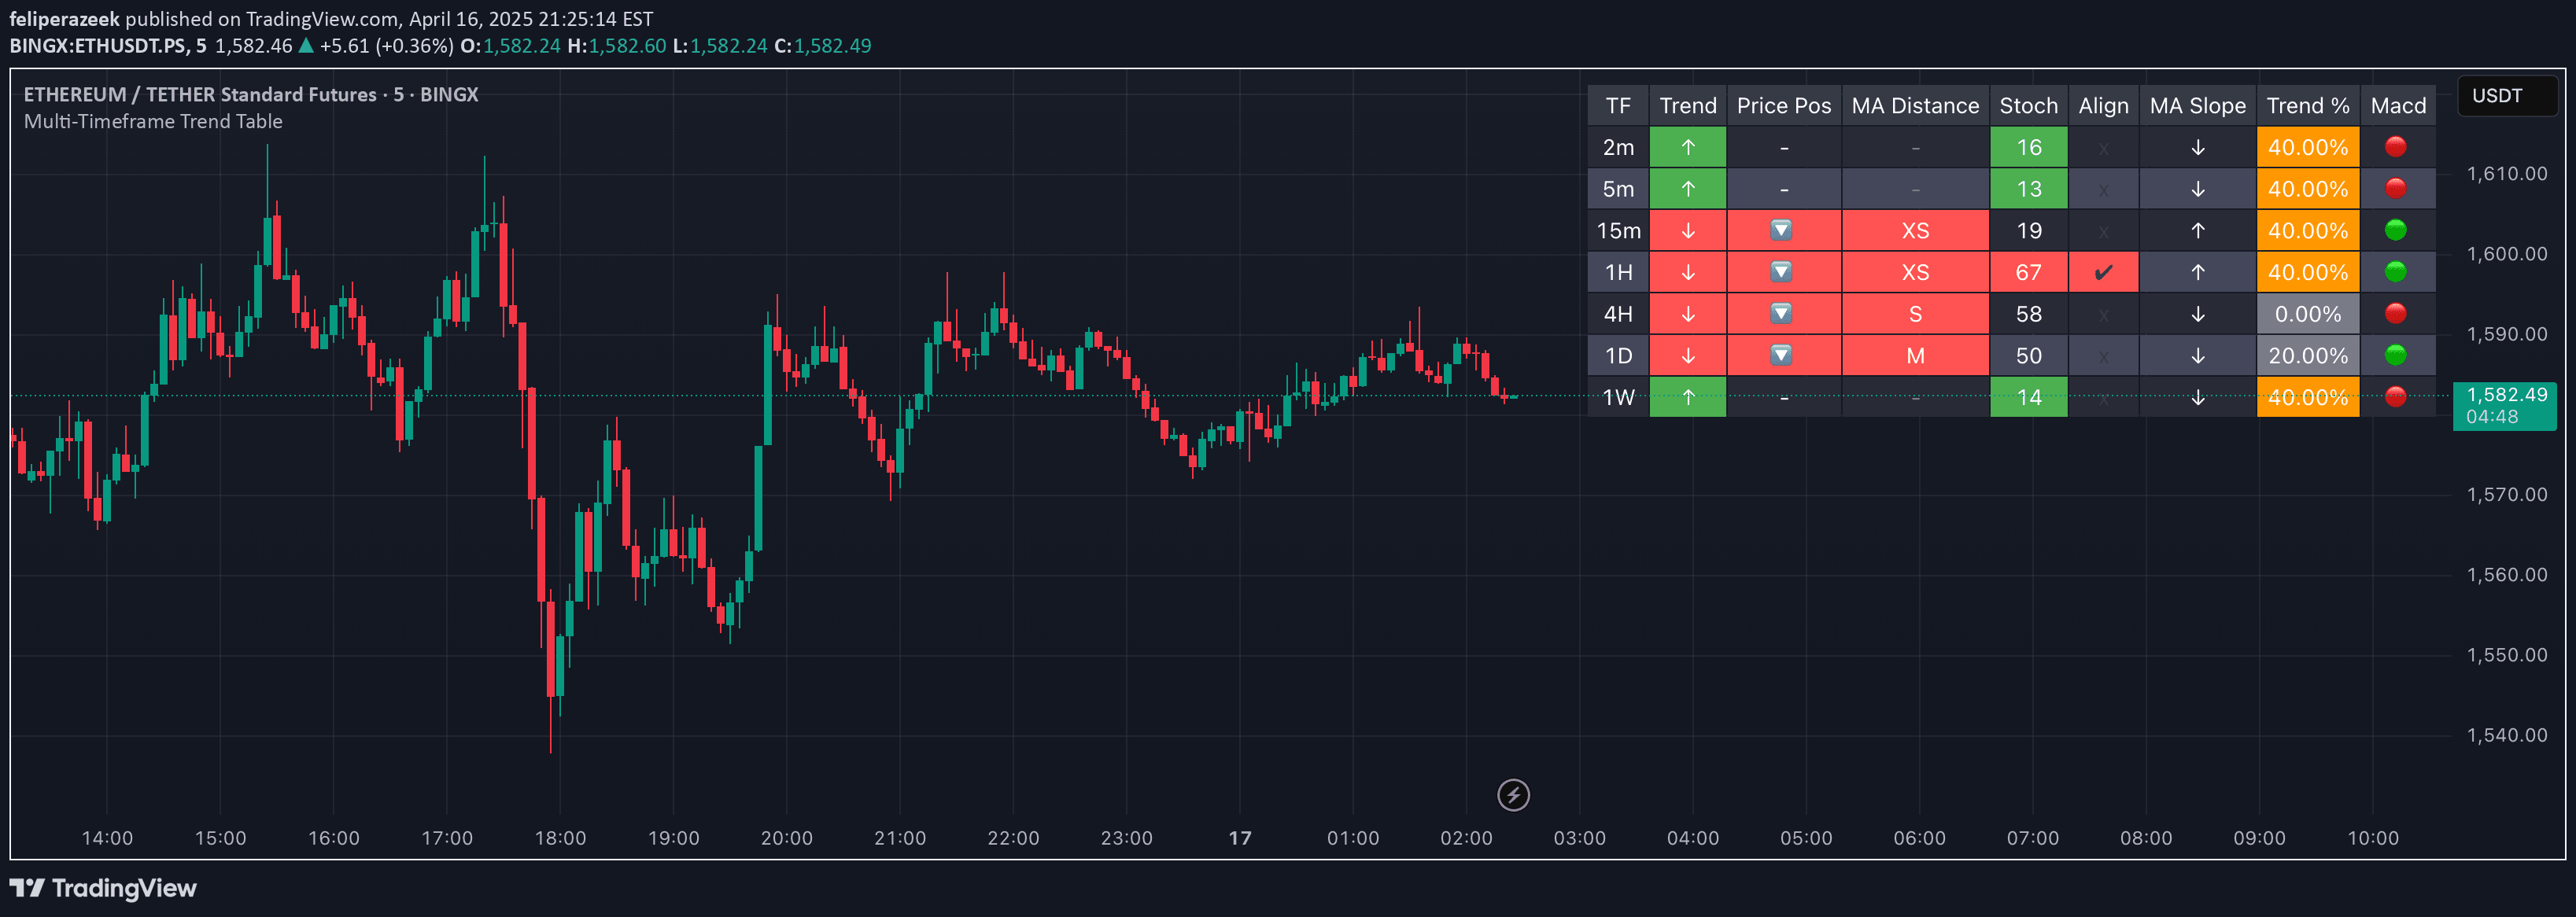
A multi-timeframe trend tracking tool using Exponential Moving Averages (EMAs) to detect trend direction, strength, and momentum across seven different timeframes.
Explore complementary indicator rolesHow it works
The Multi-Timeframe Trend Table utilizes two Exponential Moving Averages (fast and slow) to determine market trends across seven different timeframes. By comparing the positions of the 20-period and 200-period EMAs, the tool classifies each timeframe's trend as uptrend, downtrend, or sideways.
The system also analyzes EMA slopes to provide additional insight into trend behavior. It calculates the raw distance between EMAs and tracks their directional movement, offering traders a comprehensive view of market dynamics through color-coded and easily interpretable visual representations.
Why it may be useful
This trend tracking tool provides traders with a powerful, consolidated view of market trends across multiple timeframes, enabling more informed and strategic trading decisions. By offering instant visibility into trend directions and strengths, traders can quickly assess market conditions without manually switching between different chart timeframes.
The indicator's ability to detect trend changes, monitor EMA behaviors, and provide real-time alerts helps traders identify potential entry and exit points more effectively. Its versatility across different trading styles makes it a valuable tool for scalpers, day traders, and swing traders seeking a comprehensive market analysis approach.
When to explore it
The Multi-Timeframe Trend Table is most effective when traders want to confirm trades using multiple timeframe alignments and identify potential trend reversals. It is particularly useful for traders seeking to add a higher-timeframe filter to their existing trading strategies and gain a more holistic market perspective.
Traders can leverage this tool during volatile market conditions, when trend identification becomes crucial for making informed decisions. It is especially beneficial for those who want to understand underlying market trends before executing trades, helping to filter out potentially low-probability trade setups and focus on high-quality opportunities.
Keep exploring
What we’ve verified
Access, alerts and repainting behaviour have not been independently verified for this indicator. Check the creator’s current publication and settings.
General descriptions and classifications are recovered research. Verified details above identify the specific checks we have completed. Check the creator’s current publication for later changes.


