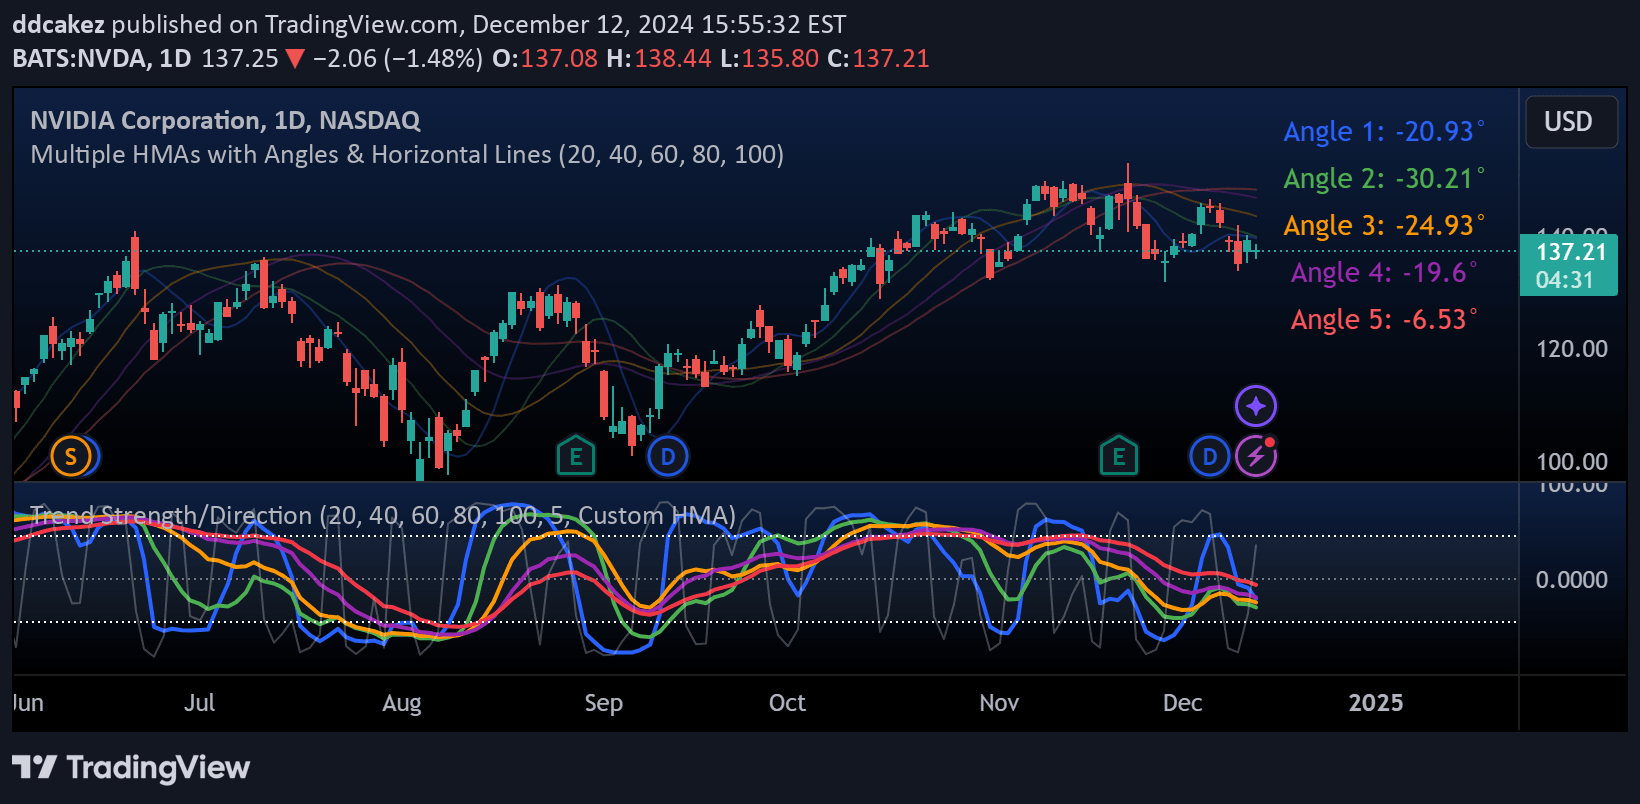
A comprehensive trend strength model using ADX that measures market direction and momentum by analyzing directional indicators and applying color-coded visual signals.
Explore complementary indicator rolesHow it works
The model utilizes the Average Directional Index (ADX) as its primary mechanism for measuring trend strength by calculating the normalized difference between positive and negative directional indicators. It employs a 50-period Simple Moving Average to smooth out short-term volatility and reduce false signals, providing a more stable trend assessment.
The indicator determines market conditions through three key parameters: ADX value, directional movement indicators (+DI and -DI), and color-coded backgrounds. When ADX is below 35, it signals a ranging market with a yellow background, while values above 35 indicate a trending market with green (bullish) or red (bearish) backgrounds based on the relationship between +DI and -DI.
Why it may be useful
This trend strength model provides traders with a comprehensive visual tool for quickly understanding market dynamics, offering immediate insights into trend direction, strength, and potential market phases. By combining multiple analytical components, it helps traders make more informed decisions about market entry and exit points.
The color-coded system simplifies complex trend analysis, allowing traders to rapidly assess market conditions without extensive technical calculations. Its multi-dimensional approach integrates trend strength, direction, and market phase identification, making it a versatile and user-friendly indicator for traders across different experience levels and trading styles.
When to explore it
The model works best in markets with clear trending characteristics, particularly during periods of sustained price movement in either bullish or bearish directions. Traders can leverage this indicator most effectively when seeking to confirm trend strength and identify potential trend reversals or continuation patterns.
It is particularly useful during intermediate to long-term trading scenarios where understanding sustained market momentum is crucial. Traders should pay special attention to the ADX threshold levels (35, 50, and 75) to gauge the intensity of market trends and potential trade opportunities.
Keep exploring
What we’ve verified
Access, alerts and repainting behaviour have not been independently verified for this indicator. Check the creator’s current publication and settings.
General descriptions and classifications are recovered research. Verified details above identify the specific checks we have completed. Check the creator’s current publication for later changes.