
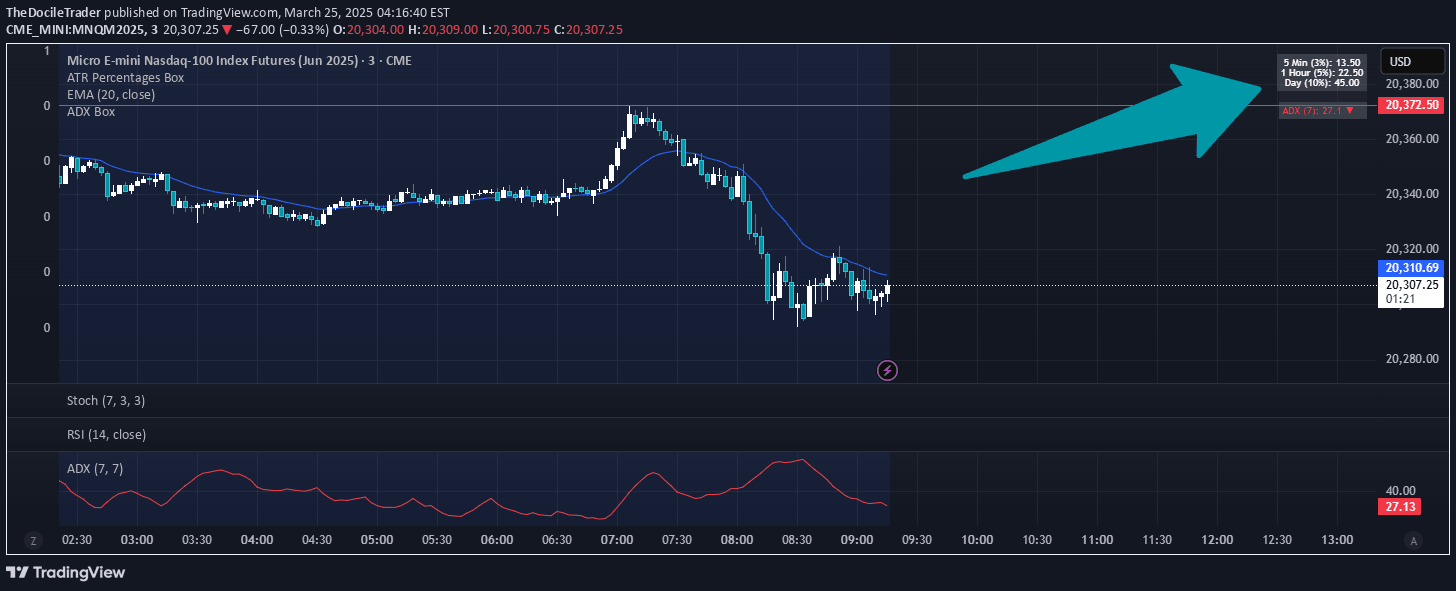
The ADX Box indicator provides a compact visual representation of trend strength by displaying the Average Directional Index with a color-coded arrow indicating trend dynamics.
Explore complementary indicator rolesHow it works
The ADX Box indicator calculates the Average Directional Index using a customizable period, typically 7 periods. It rounds the ADX value to one decimal place and displays it with a directional arrow. A green upward triangle indicates the ADX is rising above its moving average, suggesting increasing trend strength.
A red downward triangle shows the ADX declining below its moving average, signaling weakening trend strength. The indicator updates in real-time, providing traders with immediate insights into trend dynamics. It offers a simple, intuitive method to assess market momentum without complex visual clutter
Why it may be useful
The ADX Box indicator is crucial for traders seeking to understand trend strength quickly and efficiently. It provides a clear, instantaneous view of market momentum without requiring complex technical analysis. By simplifying trend information, traders can make faster and more confident decisions.
The indicator helps identify whether a current market trend is gaining or losing steam, which is essential for strategic entry and exit points. Its minimalist design ensures traders can quickly interpret market conditions without information overload. The tool bridges the gap between complex technical indicators and practical trading insights
When to explore it
The ADX Box indicator works best in trending markets with clear directional movements. It is particularly useful for trend-following strategies and breakout trading approaches. Traders can leverage this indicator during periods of sustained market momentum, whether in bullish or bearish conditions.
It performs well when combined with other technical indicators like ATR for comprehensive market analysis. The indicator is most effective on timeframes from hourly to daily charts. Swing traders and day traders can benefit from its real-time trend strength assessment. It helps filter out false signals and provides a quick trend health check
Keep exploring
What we’ve verified
Access, alerts and repainting behaviour have not been independently verified for this indicator. Check the creator’s current publication and settings.
General descriptions and classifications are recovered research. Verified details above identify the specific checks we have completed. Check the creator’s current publication for later changes.


