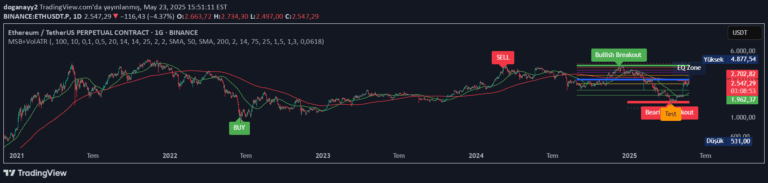
A multi-chart trading indicator analyzing price action, volume distribution, and market structure through quartile analysis, range US charts, volume aggregation, and gap tracking.
Explore complementary indicator rolesHow it works
This comprehensive indicator segments price and volume data into quartiles, creating color-coded visualization of volume distribution. It generates Range US charts that produce trend and reversal candles based on predefined price movements.
Volume Aggregation bars form after achieving specific cumulative volume thresholds. The indicator tracks market gaps, recording their frequency, size, and fill rates. It uses gradient coloring to represent volume intensity, with lime indicating high volume and red signaling low volume
Why it may be useful
Traders benefit from this indicator's multi-dimensional analysis of market behavior. By breaking down volume into quartiles, it provides objective insights into price-volume relationships. The Range US chart helps filter market noise by focusing on meaningful price movements.
Volume Aggregation bars reveal potential price levels where traders might be trapped. Gap tracking offers additional context about market sentiment and potential price reversion points. These features collectively enhance traders' understanding of market dynamics
When to explore it
This indicator is most effective in markets with consistent volume and clear price movements. It works best for assets with sufficient trading activity to generate meaningful quartile and volume data. Swing traders and day traders can utilize it to identify volume clusters, potential trend reversals, and market structure.
It's particularly useful in liquid markets like major stock indices, forex pairs, and actively traded commodities. Traders should combine this indicator with other technical analysis tools for comprehensive market assessment
Keep exploring
What we’ve verified
Access, alerts and repainting behaviour have not been independently verified for this indicator. Check the creator’s current publication and settings.
General descriptions and classifications are recovered research. Verified details above identify the specific checks we have completed. Check the creator’s current publication for later changes.