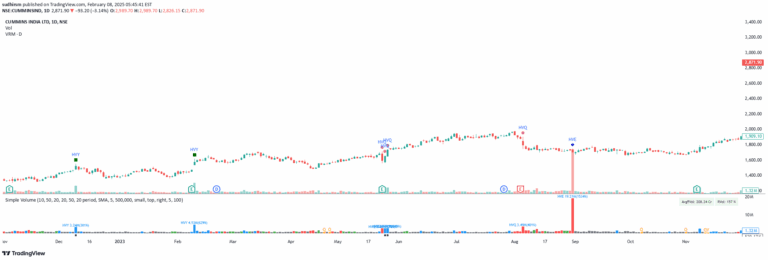
Advanced intrabar analysis tool offering multiple price representation modes, volume insights, and technical indicators to provide comprehensive market visualization and trading insights.
Explore complementary indicator rolesHow it works
The Intrabar Analyzer operates by processing granular price data, typically from 1-minute intervals, and transforming it into multiple visual representations. It can display price data in six different formats including traditional, Heikin-Ashi, Kagi, Point & Figure, Renko, and Line Break.
The tool simultaneously overlays multiple technical indicators like moving averages, trend indicators, and volume metrics. Each representation provides unique insights into price movement and market dynamics, allowing traders to observe price action from multiple perspectives simultaneously
Why it may be useful
This indicator is crucial for traders seeking comprehensive market analysis beyond standard price charts. By offering multiple price representations and simultaneous technical indicator overlays, it enables deeper market understanding and more nuanced trading decisions.
The ability to view price action through different lenses helps identify hidden patterns, trend strength, and potential reversals that might be missed in traditional charting. Its flexible configuration and multi-dimensional approach provide traders with a more robust analytical toolkit
When to explore it
The Intrabar Analyzer is most effective during volatile market conditions and for traders requiring granular market insights. It excels in short-term trading scenarios like scalping and day trading where rapid price movement interpretation is critical.
Traders can leverage this tool when analyzing complex market structures, seeking confirmation of trend changes, or wanting to validate trading signals across multiple technical perspectives. It's particularly useful for traders who appreciate multi-dimensional market analysis and want to reduce visual noise
Keep exploring
What we’ve verified
Access, alerts and repainting behaviour have not been independently verified for this indicator. Check the creator’s current publication and settings.
General descriptions and classifications are recovered research. Verified details above identify the specific checks we have completed. Check the creator’s current publication for later changes.