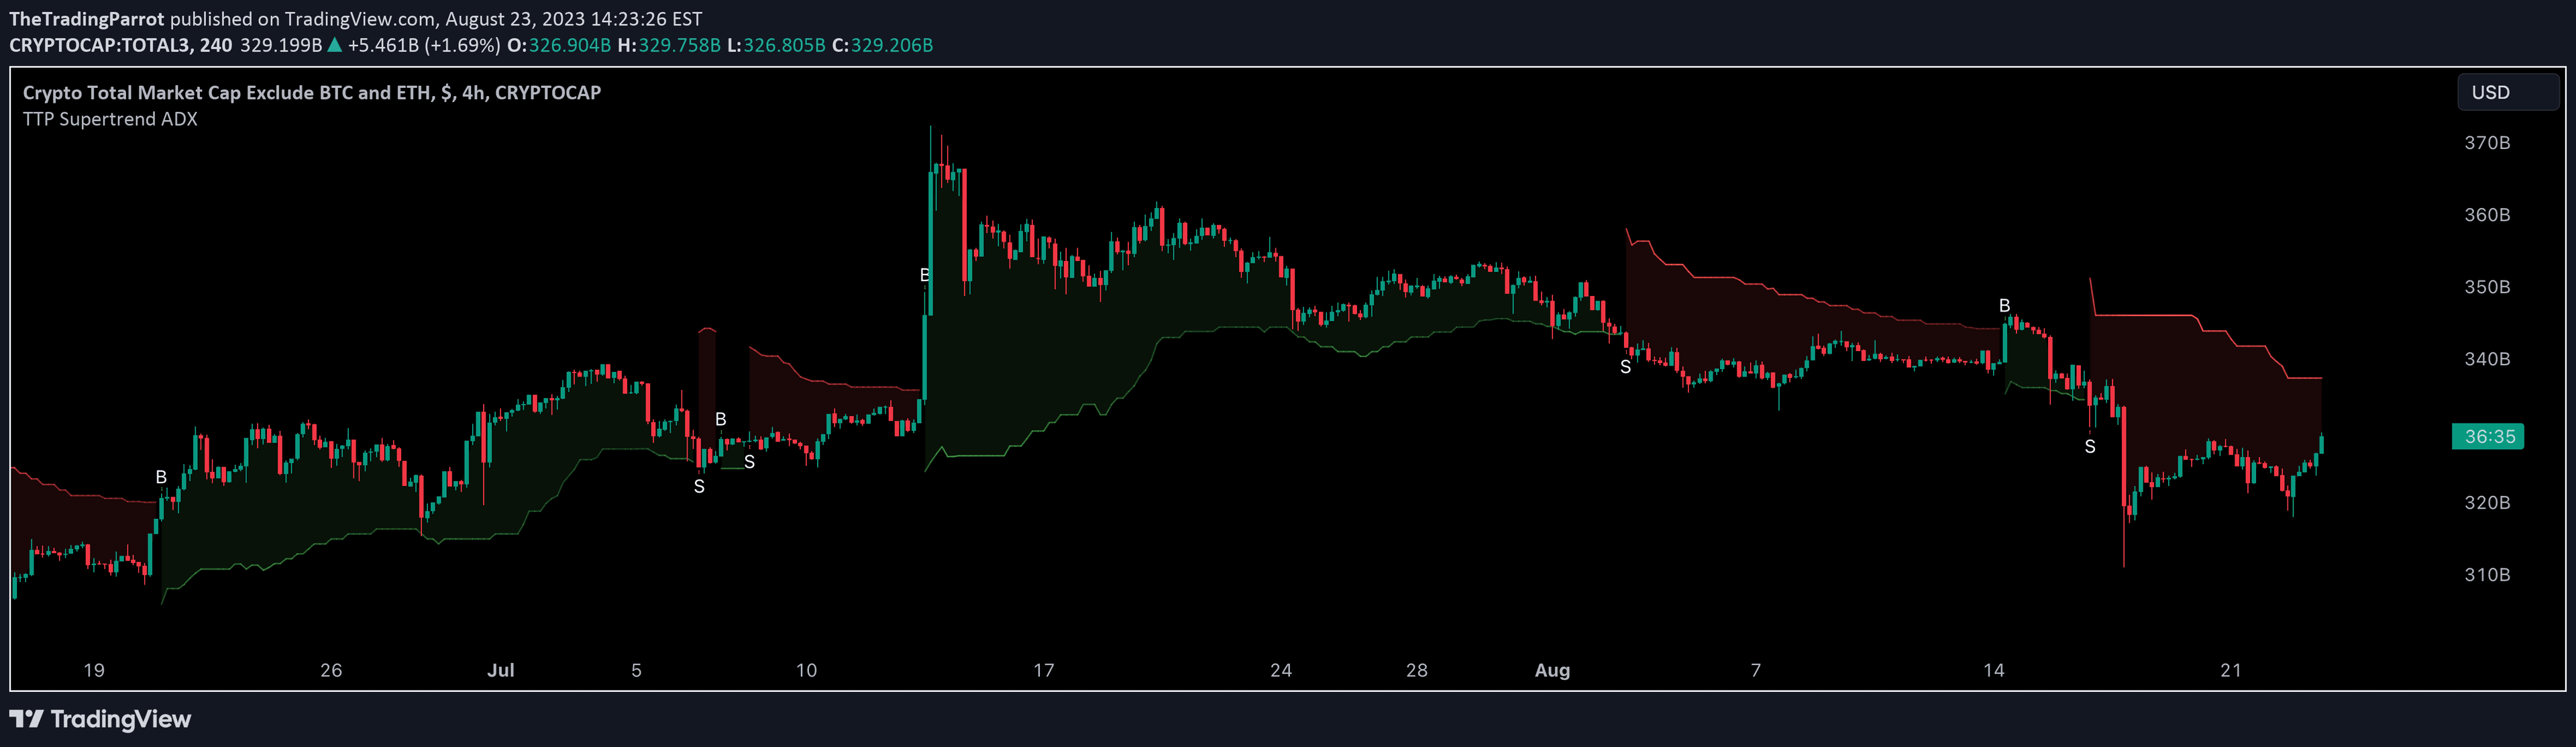
A multi-timeframe trend-following indicator using Supertrend method to generate buy and sell signals across different timeframes by analyzing price relative to dynamic support and resistance lines.
Explore complementary indicator rolesHow it works
The Multi-Timeframe Supertrend Dashboard calculates Supertrend signals by using Average True Range (ATR) to dynamically set upper and lower bands around price movements. When price moves above the Supertrend line, it generates a buy signal, indicating an uptrend, while price moving below the line triggers a sell signal, suggesting a downtrend.
The indicator adaptively tracks price action across multiple timeframes including 1-minute, 5-minute, 15-minute, hourly, daily, weekly, and monthly charts. By calculating these signals simultaneously, traders can quickly assess trend consistency and strength across different time horizons.
Why it may be useful
The Multi-Timeframe Supertrend Dashboard provides traders with a comprehensive view of market trends, enabling more informed decision-making by revealing trend alignment across various timeframes. By presenting signals in an easy-to-interpret color-coded format, traders can quickly understand market momentum and potential trade opportunities without extensively analyzing multiple charts.
This approach helps traders confirm trend strength, reduce false signal risks, and develop more robust trading strategies by considering multiple time perspectives simultaneously. The dashboard's dark mode optimization and clear visual representation make trend analysis more accessible and efficient.
When to explore it
The Multi-Timeframe Supertrend Dashboard is most effective when traders want to confirm trend directions across multiple timeframes before entering or exiting positions. It works best in markets with clear trending characteristics, where price movements are more predictable and follow consistent directional patterns.
Traders should utilize this dashboard during periods of market volatility, when trend confirmation becomes crucial for risk management. It is particularly useful for identifying potential trend reversals, assessing market momentum, and developing multi-timeframe trading strategies that leverage comprehensive trend analysis.
Keep exploring
What we’ve verified
Access, alerts and repainting behaviour have not been independently verified for this indicator. Check the creator’s current publication and settings.
General descriptions and classifications are recovered research. Verified details above identify the specific checks we have completed. Check the creator’s current publication for later changes.