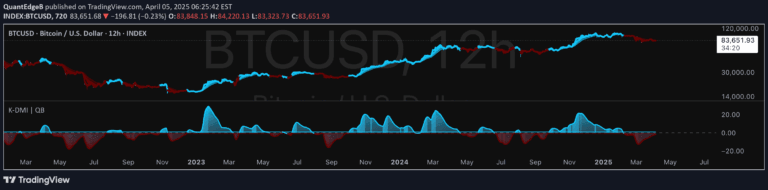
A multi-timeframe indicator that colors chart bars based on candlestick direction alignment across different timeframes, helping traders confirm trend continuity and momentum.
Explore complementary indicator rolesHow it works
The indicator calculates the directional trend of candlesticks across multiple selected timeframes, determining whether each timeframe is bullish, bearish, or neutral. It compares the current timeframe's candlestick direction with higher timeframes to ensure trend alignment.
When all selected higher timeframes show a consistent trend, the current timeframe's bars are colored accordingly - lime for bullish alignment and maroon for bearish alignment. Neutral candles can inherit the higher timeframe's direction, providing flexibility in trend visualization.
Why it may be useful
Timeframe continuity helps traders avoid trading against broader market momentum by providing visual confirmation of trend alignment across different time horizons. By directly comparing candlestick directions instead of using lagging indicators, traders can make more informed decisions about market trends.
The indicator offers transparency through its configurable settings and optional debug table, allowing traders to understand trend dynamics quickly. This approach reduces the risk of entering trades that contradict higher timeframe trends, potentially improving trading accuracy and risk management.
When to explore it
This indicator is most effective for traders seeking to confirm trend consistency across multiple timeframes before entering a trade. It works best in markets with clear directional movements, such as stocks, forex, and cryptocurrencies, where trend alignment can provide additional trading confidence.
Traders can utilize this tool across various trading styles, from scalping to swing trading, by selecting appropriate higher timeframes that match their trading strategy. It is particularly useful during trending market conditions when maintaining alignment with broader market momentum is crucial for successful trading.
Keep exploring
What we’ve verified
Access, alerts and repainting behaviour have not been independently verified for this indicator. Check the creator’s current publication and settings.
General descriptions and classifications are recovered research. Verified details above identify the specific checks we have completed. Check the creator’s current publication for later changes.