HTF Candle Insights (Expo)
HTF Candle Insights helps traders analyze market trends across different timeframes by displaying higher timeframe candles directly on the current chart, enabling comprehensive market analysis.
Explore 11,183 indicators. Filter beyond the obvious.
Discover the tools that fit the way you trade.
11,183 tools to explore
HTF Candle Insights helps traders analyze market trends across different timeframes by displaying higher timeframe candles directly on the current chart, enabling comprehensive market analysis.
LTF Candle Insights offers a dual-view trading indicator that overlays lower timeframe candles onto the current chart, enabling detailed market trend and price level analysis.
A trading dashboard tracking multiple signals with advanced price action analysis, highlighting reversal patterns, timeframe continuity, and key market indicators.
A trading indicator that identifies price imbalances like fair value gaps and large candle wicks across different timeframes, helping traders spot potential liquidity and rebalancing opportunities.
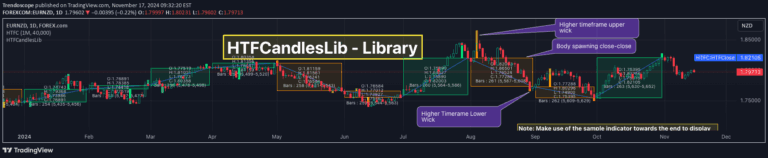
HTFCandlesLib is a library for analyzing higher timeframe candle data, providing detailed insights into candle characteristics and enabling advanced multi-timeframe trading strategies.
A timeframe continuity indicator that visualizes price positioning relative to multiple timeframe opens, helping traders understand market momentum and potential range limitations.
A custom trading tool for visualizing specific market sessions and price action across different timeframes, allowing traders to define and analyze custom time periods.
A feature displaying higher time frame analysis by allowing traders to view multiple time frame periods in a box, helping to understand broader market context and trends.
A multi-timeframe candlestick pattern detection system that identifies engulfing signals and 3 Line Strike patterns with enhanced visibility for significant price movements.
A trading strategy that identifies specific candlestick formations across multiple timeframes to help traders recognize potential price action setups and market dynamics.
An auto-magnifier tool that zooms into main timeframe candles, revealing lower timeframe price action and volume details with customizable visualization.
Dynamic Open Levels is a TradingView indicator that visualizes key opening price levels across multiple timeframes, helping traders analyze market movements with customizable settings.
Likes, views, and comments are historical TradingView snapshots. They describe attention, not trading performance.