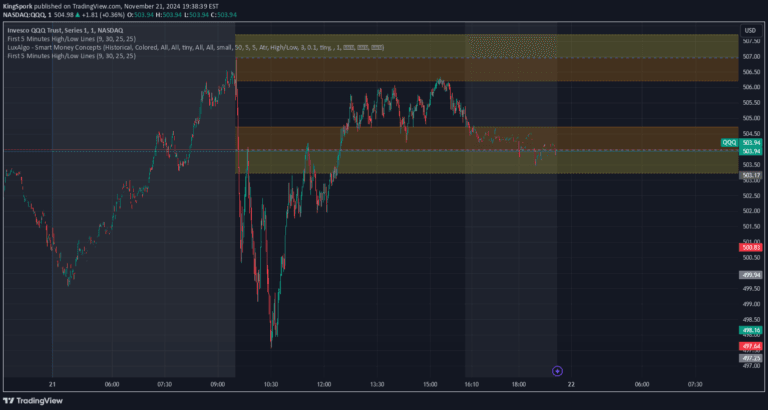
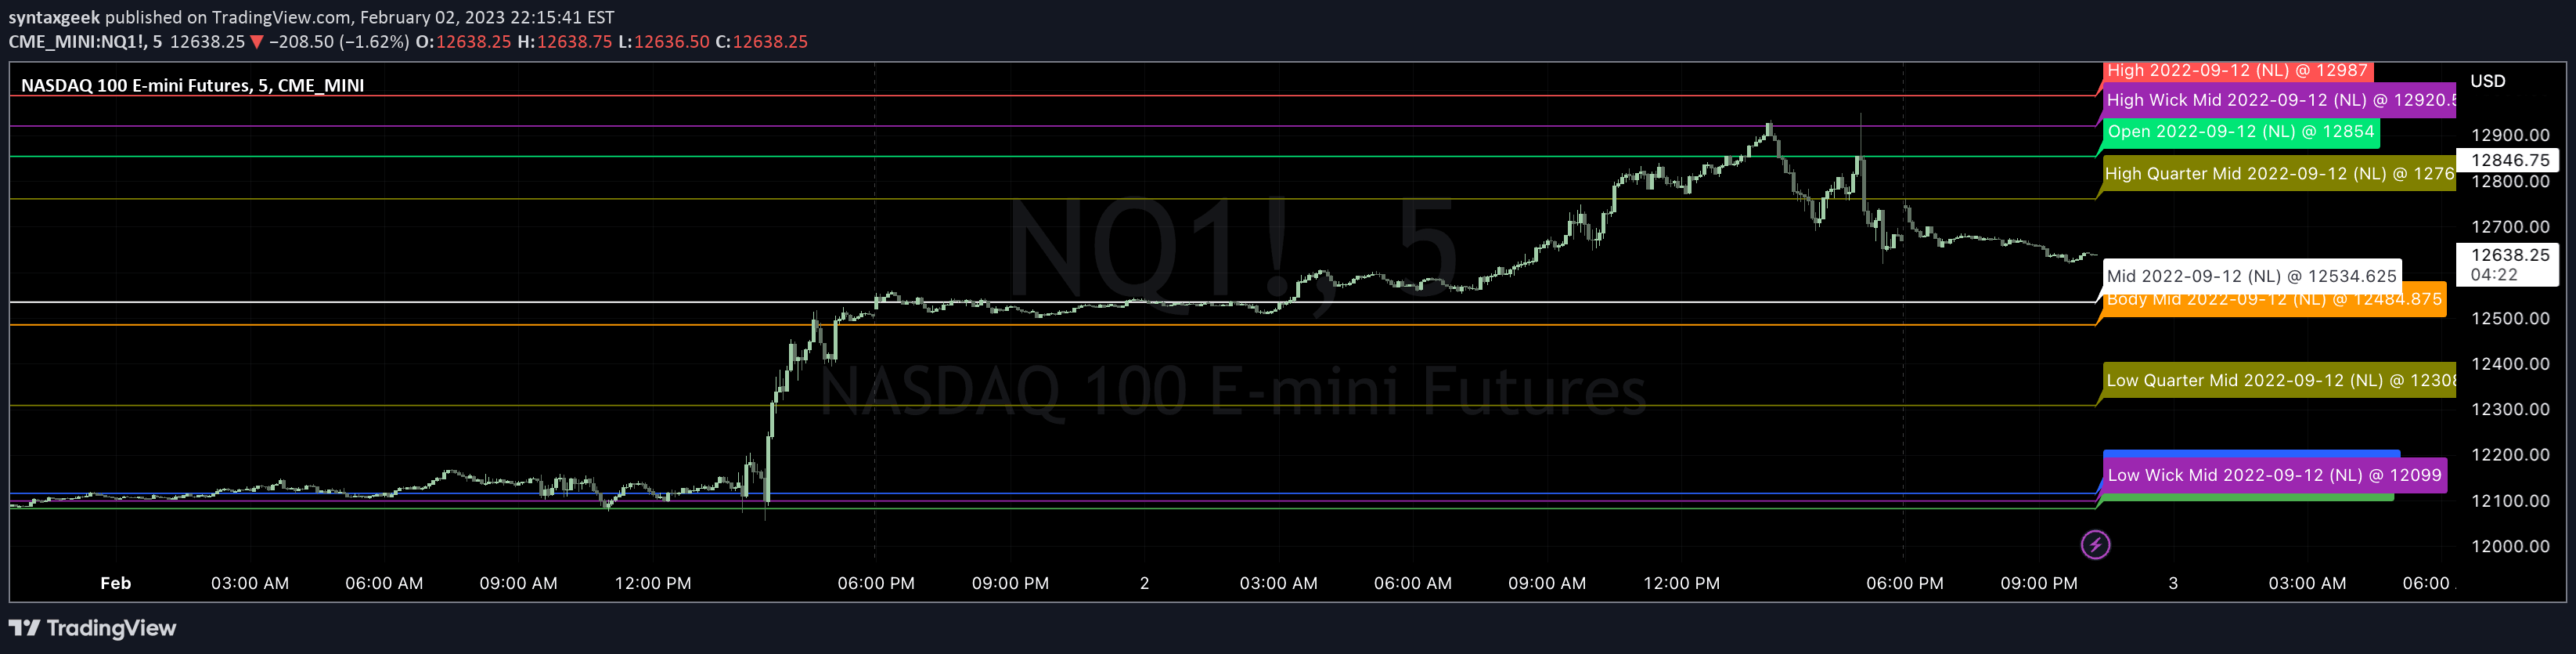
Dynamic Open Levels is a TradingView indicator that visualizes key opening price levels across multiple timeframes, helping traders analyze market movements with customizable settings.
Explore complementary indicator rolesHow it works
The Dynamic Open Levels indicator calculates and plots opening price levels for multiple timeframes, including yearly, quarterly, monthly, weekly, daily, 4H, and 1H. It automatically draws these levels on the chart, extending them to the right to provide a consistent reference for potential future price movements.
The indicator uses dynamic coloring to highlight market conditions, changing line colors between teal for bullish and coral for bearish scenarios. Each level is labeled with its corresponding timeframe (Y, Q, M, etc.) and can be customized in terms of thickness, visibility, and appearance.
Why it may be useful
Traders benefit from having a comprehensive view of key opening levels across different timeframes, which helps in identifying potential support and resistance zones. The indicator provides a multi-dimensional perspective of market structure, allowing traders to make more informed decisions about entry and exit points.
By offering real-time updates and customizable settings, the Dynamic Open Levels indicator helps traders adapt to changing market conditions quickly. The ability to toggle visibility, adjust line colors, and configure label settings makes it a versatile tool for technical analysis.
When to explore it
The Dynamic Open Levels indicator is most effective for traders looking to understand market structure and identify potential turning points across multiple timeframes. It is particularly useful during volatile market conditions where understanding key levels can provide critical insights into potential price movements.
Traders can utilize this indicator in various market environments, from trending to ranging markets, by adjusting the visibility of different timeframe levels. It is especially valuable for day traders and scalpers who need quick, visual references to make rapid trading decisions.
Keep exploring
What we’ve verified
Access, alerts and repainting behaviour have not been independently verified for this indicator. Check the creator’s current publication and settings.
General descriptions and classifications are recovered research. Verified details above identify the specific checks we have completed. Check the creator’s current publication for later changes.