An automated tool for plotting precise candle-based chart levels, allowing interactive selection of timeframes and customizable label options for trading analysis.
Explore complementary indicator rolesHow it works
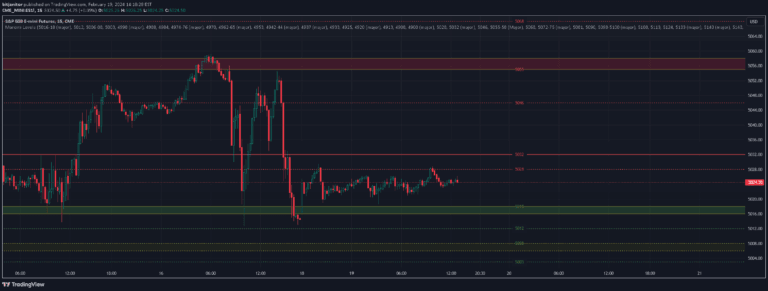
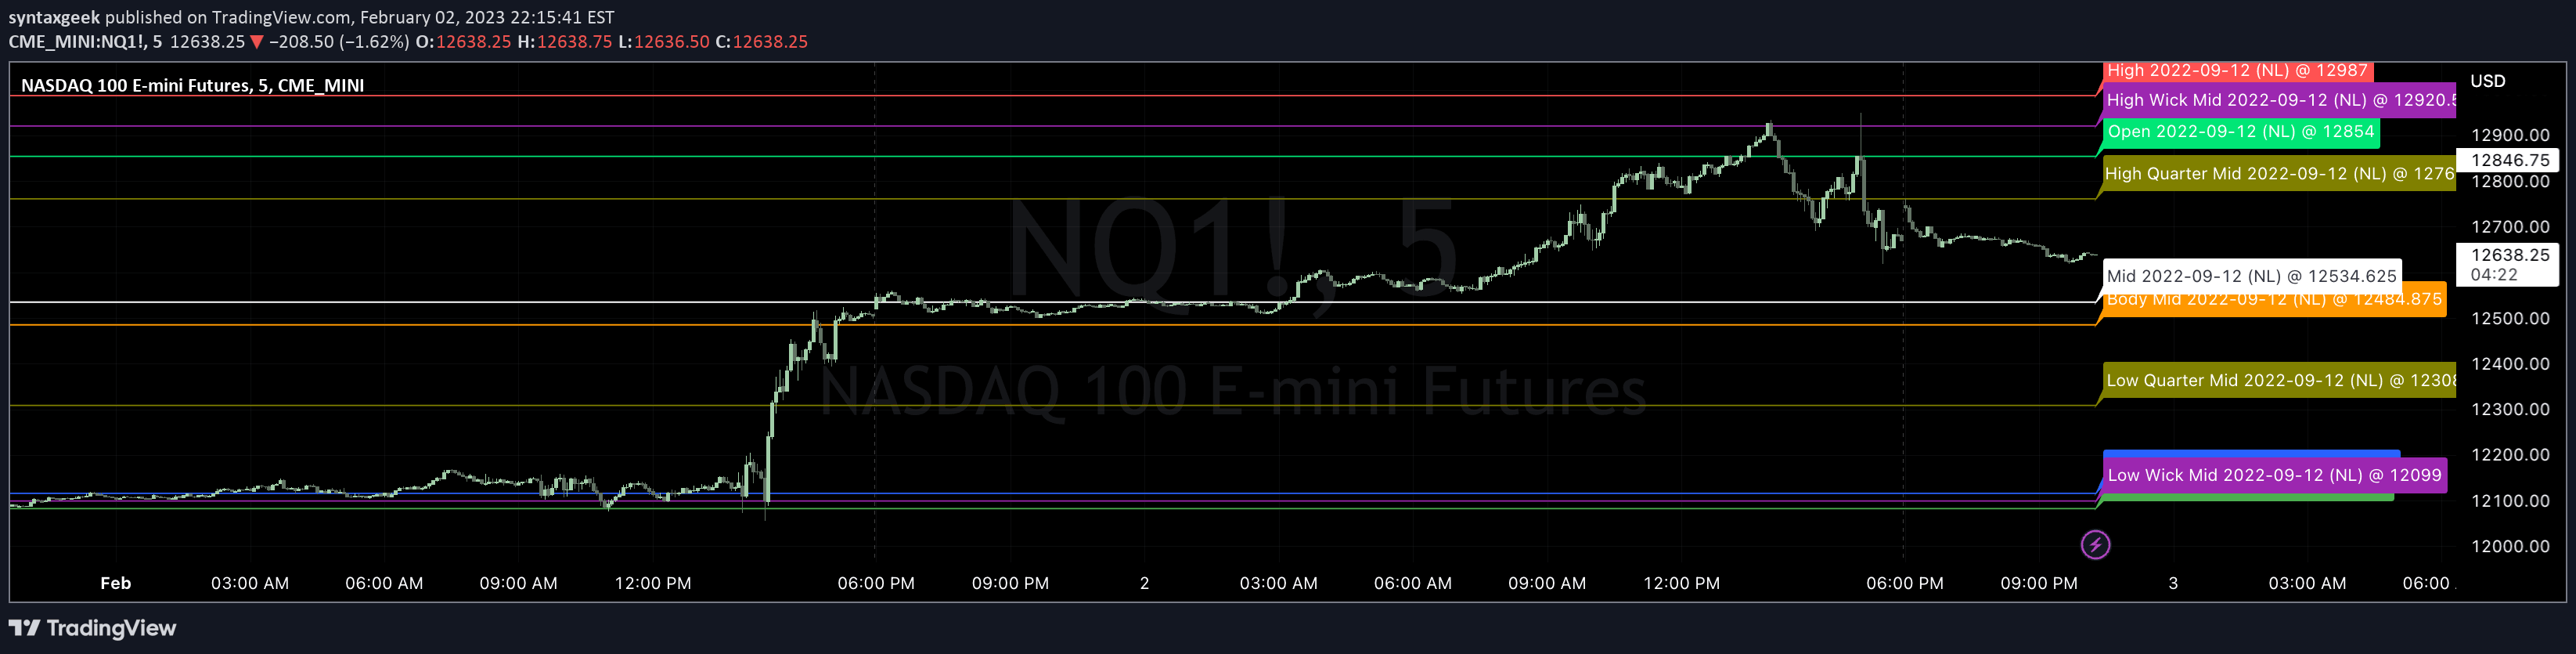
The Candle Levels tool automatically generates multiple precise levels based on different candle characteristics, including standard OHLC points, mid-points between close and open, and specific wick mid-points. Traders can interactively select a candle and timeframe, which triggers the tool to plot these levels directly on the chart with customizable visual settings.
The tool provides flexibility in level visualization by offering options to display or hide labels, customize colors, and add personal notes. Users can choose to show time, price, or disable labels entirely, making the tool adaptable to different trading preferences and analysis styles.
Why it may be useful
Candle Levels provide traders with a systematic approach to identifying key price reference points within individual candlesticks, offering deeper insights into potential support, resistance, and price movement dynamics. By breaking down each candle into multiple meaningful levels, traders can gain a more nuanced understanding of market structure and potential entry or exit points.
The tool's interactive and customizable nature allows traders to adapt the visualization to their specific trading strategy, making complex price analysis more accessible and user-friendly. This approach helps traders make more informed decisions by providing multiple perspective points within a single candlestick.
When to explore it
The Candle Levels tool is most effective when analyzing markets with clear and distinct candlestick patterns, such as futures, stocks, and various timeframes. Traders can benefit from this tool when they want to break down price action into more granular components and identify potential turning points or areas of market interest.
It is particularly useful for traders who need precise level identification and want to customize their chart analysis without manually drawing multiple reference lines. The tool's versatility makes it suitable for scalpers, day traders, and swing traders looking to enhance their technical analysis approach.
Keep exploring
What we’ve verified
Access, alerts and repainting behaviour have not been independently verified for this indicator. Check the creator’s current publication and settings.
General descriptions and classifications are recovered research. Verified details above identify the specific checks we have completed. Check the creator’s current publication for later changes.