
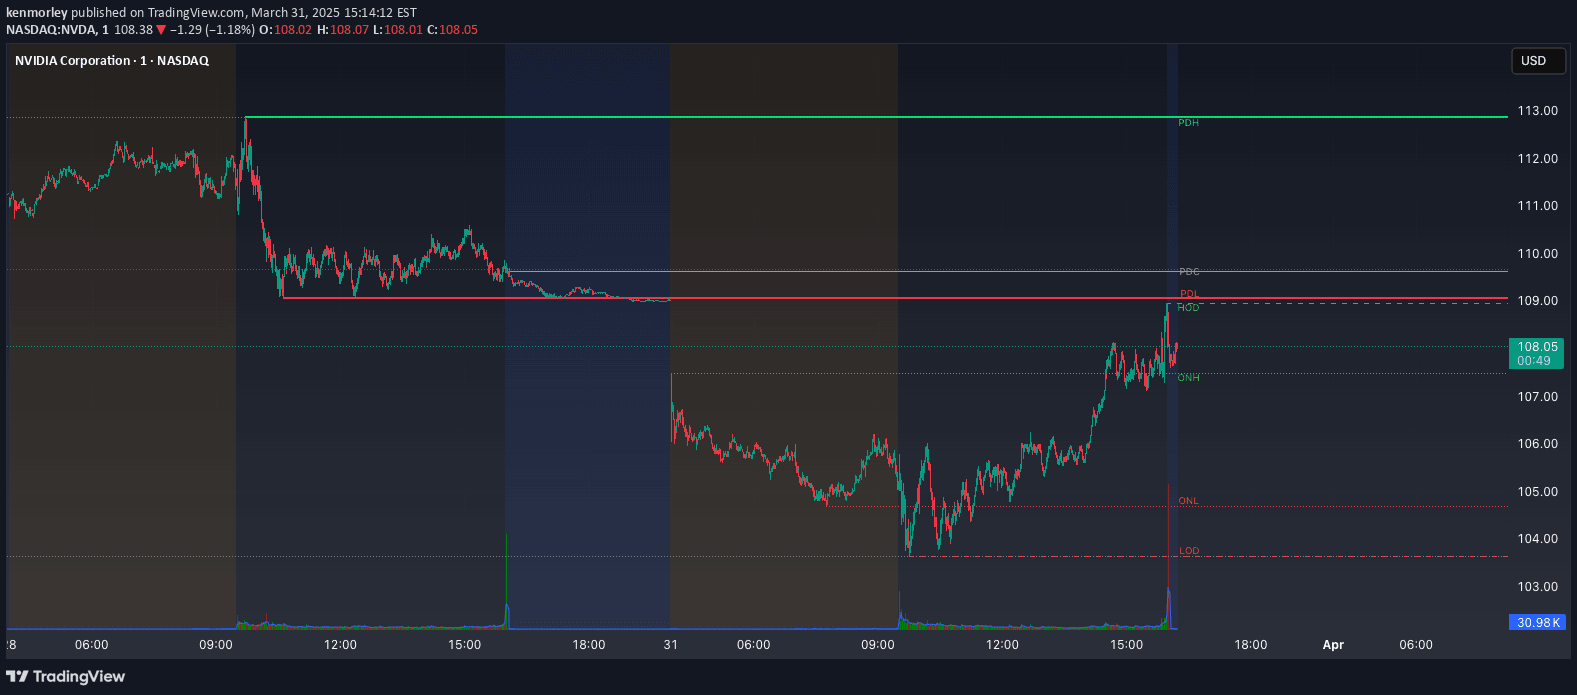
A custom indicator that plots key trading levels including current session highs/lows, previous day levels, and overnight high/low for precise market analysis and trading decisions.
Explore complementary indicator rolesHow it works
This indicator dynamically tracks and plots critical price levels throughout a trading session, creating visual markers for key reference points. It automatically calculates and displays the current session's high and low points, as well as the previous day's high, low, and close prices.
Additionally, the indicator calculates overnight high and low levels based on a predefined trading window. At the start of each new trading session, the indicator resets and generates a fresh set of labels, positioning them in a fixed horizontal column with precise vertical alignment to correspond with their respective price levels.
Why it may be useful
By providing a comprehensive visual representation of key price levels, this indicator helps traders quickly identify critical support and resistance zones for potential entry and exit points. It offers a structured approach to understanding market structure, allowing traders to make more informed decisions based on historical and current price dynamics.
The indicator's ability to automatically update and reset levels reduces manual tracking effort and provides a consistent framework for analyzing market movements. Traders can customize colors, line styles, and positioning to match their specific trading preferences and market environment.
When to explore it
This indicator is most effective for day traders and scalpers who require precise, real-time tracking of market levels across different timeframes. It works particularly well in liquid markets with clear intraday price movements, such as futures, stocks, and forex trading.
Traders can benefit most from this tool during active market hours when price levels are more dynamic and meaningful. It is especially useful for identifying potential support and resistance zones, tracking session-specific price action, and making quick trading decisions based on key level interactions.
Keep exploring
What we’ve verified
Access, alerts and repainting behaviour have not been independently verified for this indicator. Check the creator’s current publication and settings.
General descriptions and classifications are recovered research. Verified details above identify the specific checks we have completed. Check the creator’s current publication for later changes.


