Drip's 11am rule breakout/breakdown (OG)
A trading strategy focusing on identifying potential price continuation after 11:30 AM EST, using high/low of day zones and momentum indicators to signal trading opportunities.
Explore 11,183 indicators. Filter beyond the obvious.
Discover the tools that fit the way you trade.
11,183 tools to explore
A trading strategy focusing on identifying potential price continuation after 11:30 AM EST, using high/low of day zones and momentum indicators to signal trading opportunities.
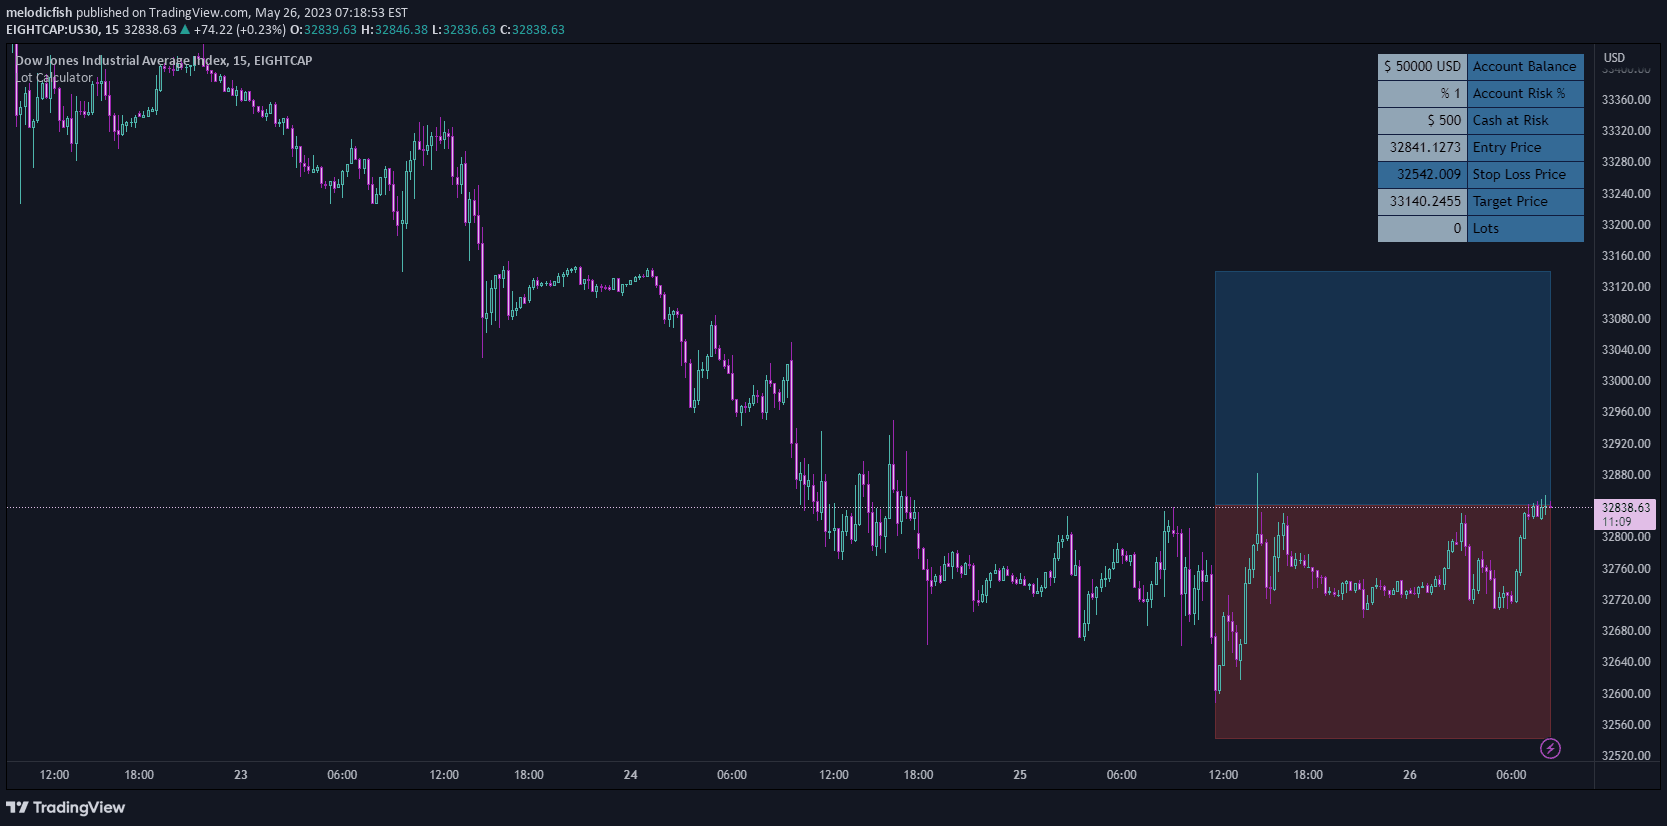
A versatile lot size calculator that helps traders manage risk by dynamically calculating position sizes based on entry, stop levels, account risk, and trading instrument.
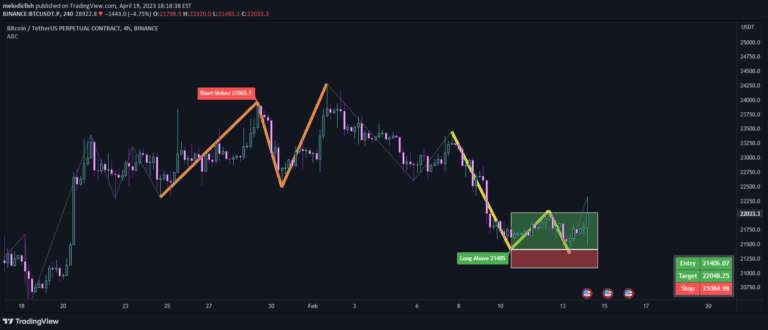
An ABC Pattern finding tool that helps traders identify specific price formations with customizable bar settings and automatic trade box generation for precise entry and exit levels.
A dynamic trading indicator tracking previous and current day high/low levels with customizable visualization to help traders identify key support and resistance zones throughout the trading session.
A statistical indicator tracking the hourly likelihood of an asset's highest and lowest price points throughout the trading day, providing insights into price timing patterns.
Advanced Bollinger Bands strategy using dual-length periods to analyze market volatility and identify potential trend breakouts with color-coded visual signals.
A trading indicator that identifies market range and potential breakout zones by analyzing historical price levels during a specific time period and market session.
A custom indicator that plots key trading levels including current session highs/lows, previous day levels, and overnight high/low for precise market analysis and trading decisions.
MC High/Low is a real-time tracking tool that displays critical daily and weekly price levels with minimalist precision, offering traders clean visual reference points for market structure.
A technical indicator tracking the simultaneous high or low points of major American market sectors (QQQ, XLF, XLV) to gauge market strength and potential trading direction.
A technical analysis method using 20 and 50 moving averages to quickly identify stock trends and potential trading directions based on crossover signals.
A grid-based indicator that plots horizontal price levels with customizable spacing and increments across different market types, helping traders identify key support and resistance zones.
Likes, views, and comments are historical TradingView snapshots. They describe attention, not trading performance.