
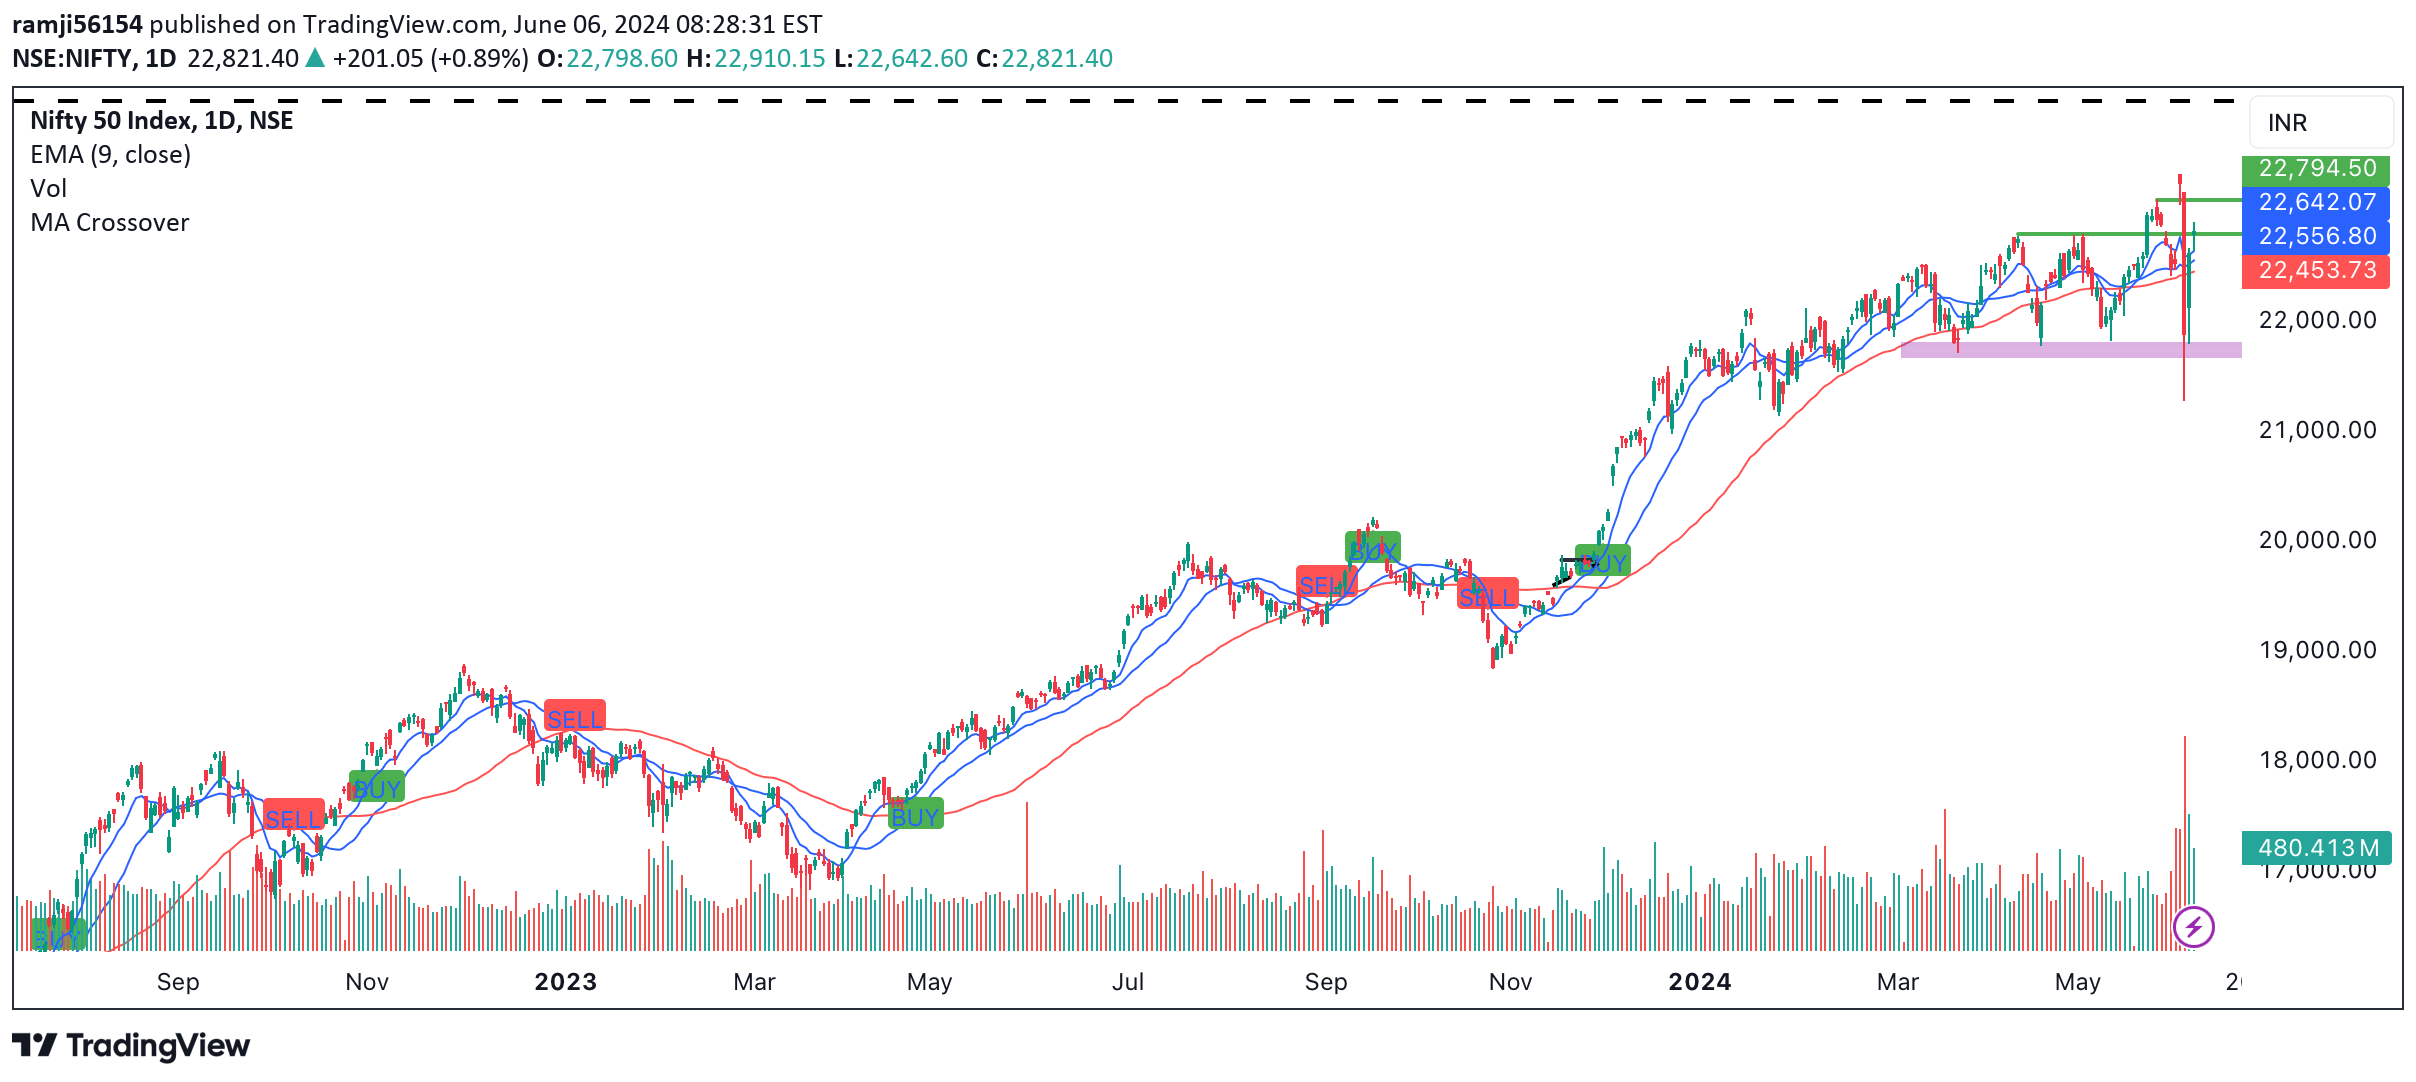
A technical analysis method using 20 and 50 moving averages to quickly identify stock trends and potential trading directions based on crossover signals.
Explore complementary indicator rolesHow it works
The moving average crossover strategy focuses on tracking the intersection of two moving averages with different time periods. When the shorter-term 20-day moving average crosses above the longer-term 50-day moving average, it generates a bullish signal indicating potential upward momentum. Conversely, when the 20-day moving average crosses below the 50-day moving average, it suggests a bearish trend and potential downward price movement.
Traders use these crossover points as key indicators of trend changes, helping them make informed decisions about entering or exiting trades. The method provides a simple yet effective way to understand market sentiment and potential price direction by smoothing out price fluctuations and identifying underlying trend movements.
Why it may be useful
Moving average crossovers are crucial for traders because they offer a clear, visual representation of market trends without complex analysis. By comparing two moving averages, traders can quickly assess whether a stock is trending upward, downward, or moving sideways. This approach helps reduce emotional decision-making and provides a systematic method for identifying potential trading opportunities.
The strategy is particularly valuable because it can be applied across various financial instruments and timeframes, making it versatile for different trading styles. It offers a straightforward way to filter out market noise and focus on significant trend changes, helping traders make more objective and disciplined investment decisions.
When to explore it
The moving average crossover strategy works best in trending markets with clear directional movements, where prices are consistently moving up or down. It is most effective in stocks, indices, and other financial instruments that exhibit sustained momentum and are not experiencing excessive sideways or choppy trading conditions. Traders should preferably use this method in markets with moderate volatility to minimize false signals.
This technique is particularly useful during strong bull or bear markets and can be complemented with other technical indicators for more robust trading signals. Traders should be cautious during periods of high market uncertainty or when trading thinly traded securities, as the crossover signals might be less reliable in such scenarios.
Keep exploring
What we’ve verified
Access, alerts and repainting behaviour have not been independently verified for this indicator. Check the creator’s current publication and settings.
General descriptions and classifications are recovered research. Verified details above identify the specific checks we have completed. Check the creator’s current publication for later changes.


