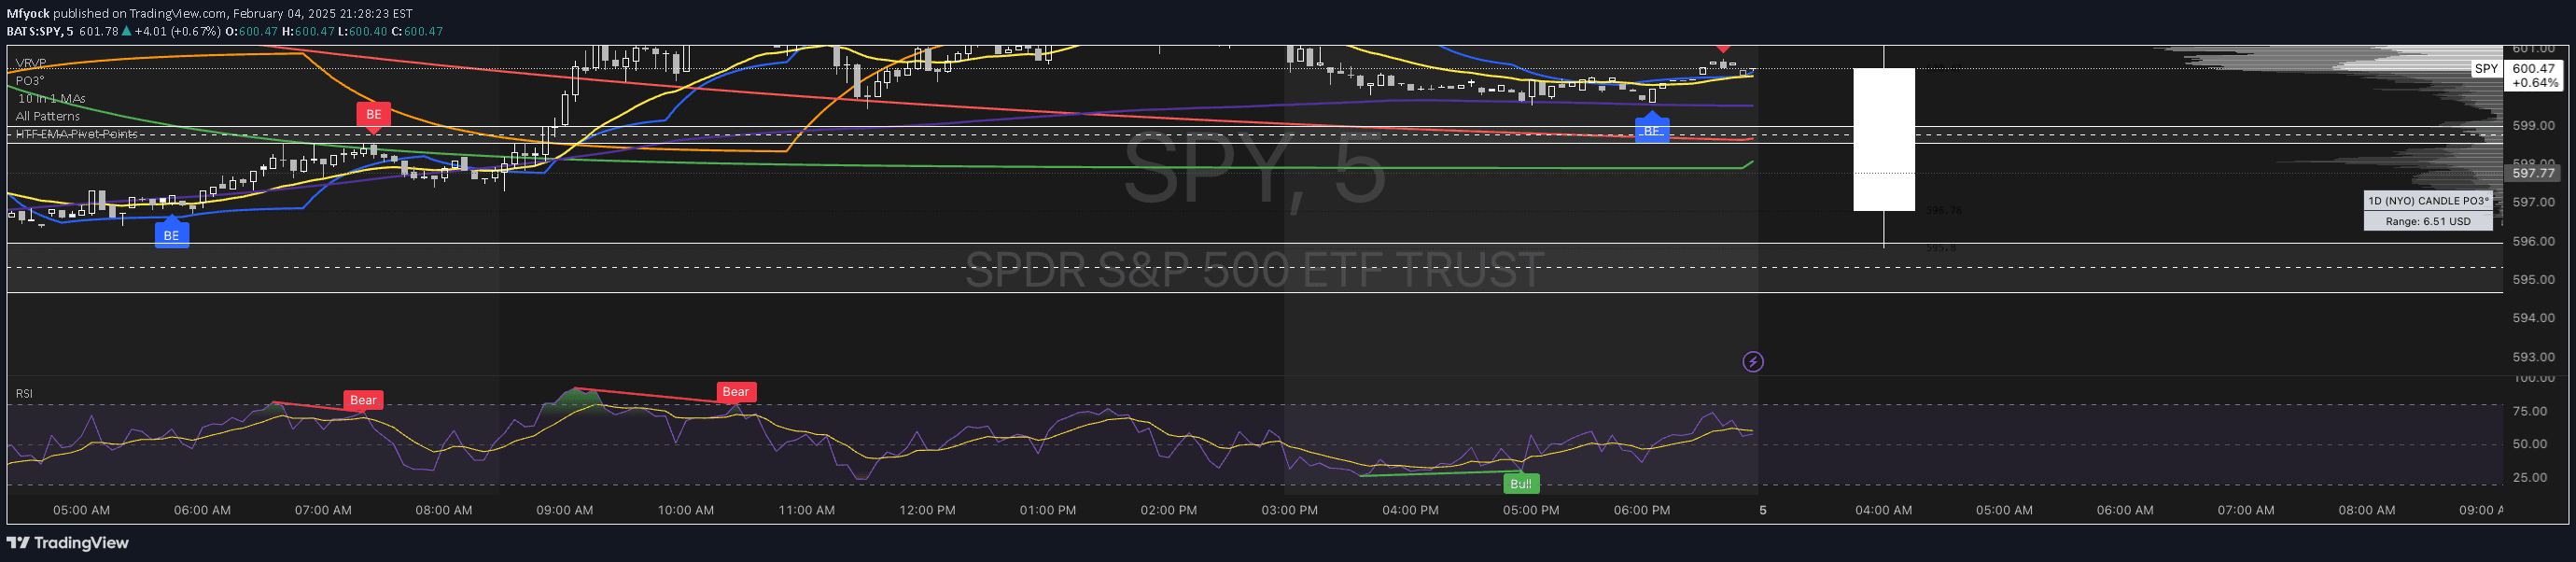
A dynamic moving average indicator that can incorporate Fibonacci values and multiple timeframes, offering flexible configuration for technical analysis and trading strategies.
Explore complementary indicator rolesHow it works
The moving average indicator operates by calculating average price points over specified periods, creating trend-tracking lines on the chart. It dynamically adapts by allowing integration of Fibonacci values and averages from multiple timeframes, enabling traders to customize their analysis.
By configuring different moving average lengths and types, traders can create complex trend-tracking systems. The indicator's flexibility allows adding or removing averages easily, making it adaptable to various trading styles and market conditions.
Why it may be useful
Moving average indicators help traders identify market trends, potential entry and exit points, and overall price momentum by smoothing out price fluctuations. They provide visual representations of market direction, helping traders make more informed decisions by filtering out short-term market noise.
The ability to incorporate multiple timeframes and Fibonacci values enhances the indicator's analytical power, allowing traders to gain deeper insights into market behavior. This approach can improve trade timing and increase the probability of successful trading strategies.
When to explore it
This moving average indicator is most effective during trending markets where price shows clear directional movement, either upward or downward. It works particularly well in markets with consistent momentum, helping traders identify and follow established trends.
Traders can optimize the indicator's performance by adjusting average lengths and incorporating multiple timeframes, making it suitable for various market conditions and trading styles. It is especially useful for traders seeking a flexible, customizable trend-tracking tool.
Keep exploring
What we’ve verified
Access, alerts and repainting behaviour have not been independently verified for this indicator. Check the creator’s current publication and settings.
General descriptions and classifications are recovered research. Verified details above identify the specific checks we have completed. Check the creator’s current publication for later changes.