
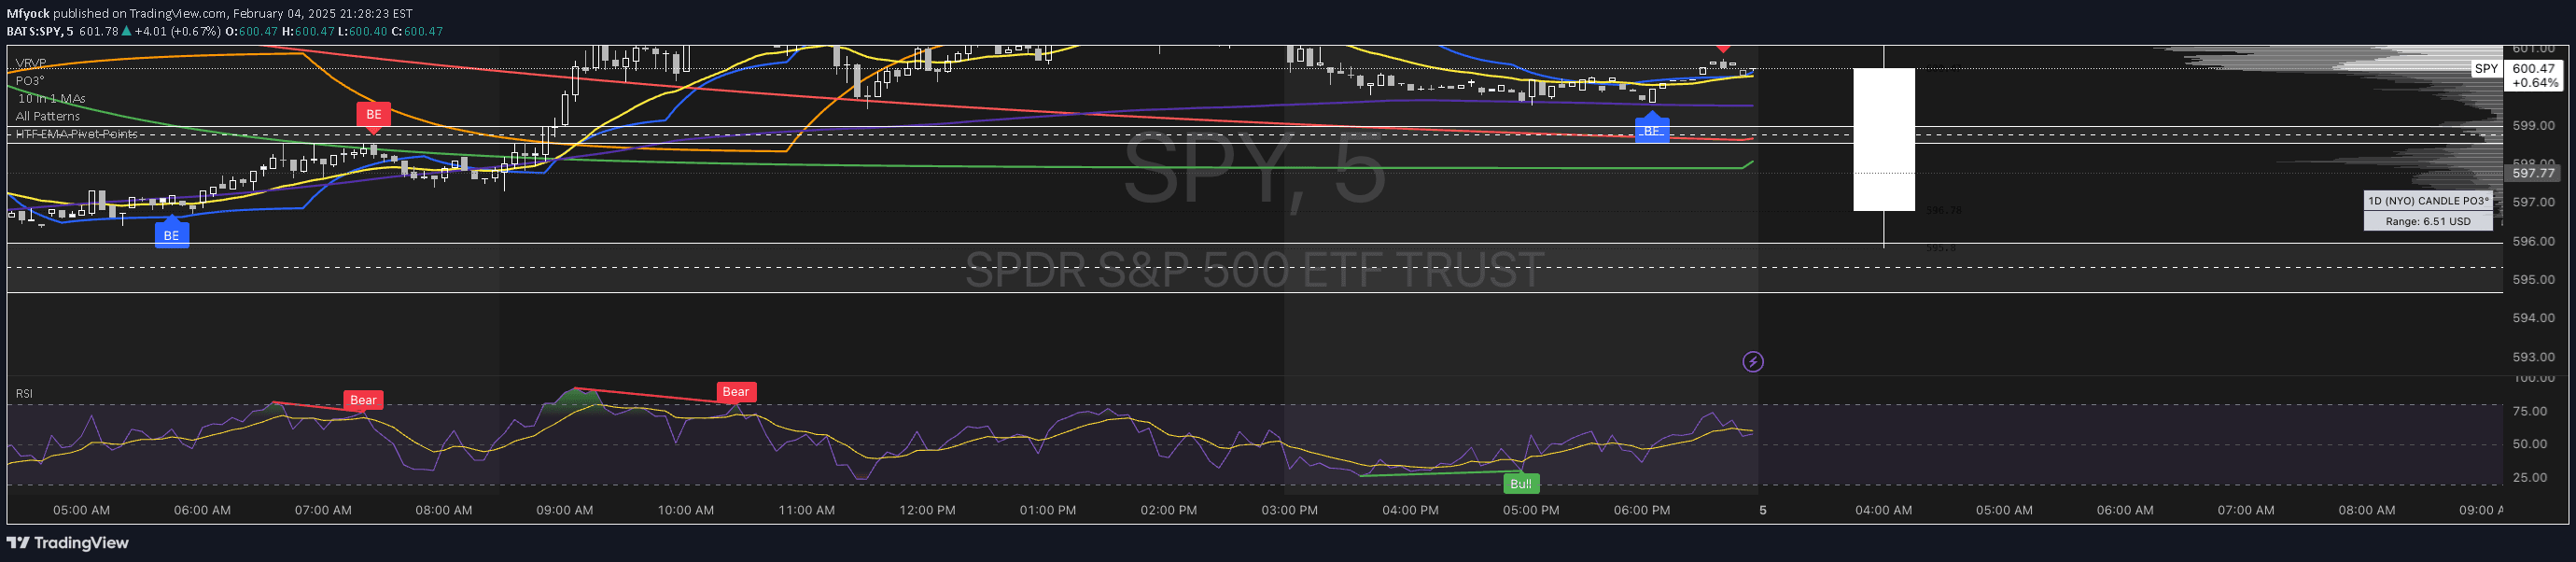
HTF EMA Pivot Points indicator displays dynamic support and resistance levels using Exponential Moving Averages from higher timeframes to help traders identify key price reaction zones.
Explore complementary indicator rolesHow it works
The HTF EMA Pivot Points indicator calculates Exponential Moving Averages from multiple higher timeframes, including 1-hour, 4-hour, and daily charts. These EMAs are then overlaid on the current trading chart, creating dynamic support and resistance levels that traders can use for analysis.
By plotting these higher timeframe EMAs, the indicator helps traders visualize potential price reaction zones where institutional-level support and resistance might occur. The EMAs serve as flexible pivot points that adapt to changing market conditions, providing traders with a more nuanced view of potential price movements.
Why it may be useful
Higher timeframe EMAs provide traders with a more comprehensive view of market trends and potential price movements beyond the immediate timeframe. By incorporating multiple timeframe perspectives, traders can gain insights into broader market dynamics and filter out lower timeframe noise that might lead to false signals.
The indicator helps traders identify key institutional levels where price is likely to react, offering a strategic advantage in understanding potential support and resistance zones. This approach allows for more informed trading decisions by providing context from multiple timeframe perspectives.
When to explore it
The HTF EMA Pivot Points indicator is most effective in markets with clear trending characteristics, where price tends to respect higher timeframe moving averages. Traders can use this tool during periods of sustained market movement, particularly when looking to confirm trend direction or identify potential entry and exit points.
The indicator works best when combined with other confirmation tools like RSI, Fair Value Gaps, or order flow analysis. It is particularly useful for traders seeking to understand broader market trends and make more strategic trading decisions across different timeframes and trading styles.
Keep exploring
What we’ve verified
Access, alerts and repainting behaviour have not been independently verified for this indicator. Check the creator’s current publication and settings.
General descriptions and classifications are recovered research. Verified details above identify the specific checks we have completed. Check the creator’s current publication for later changes.


