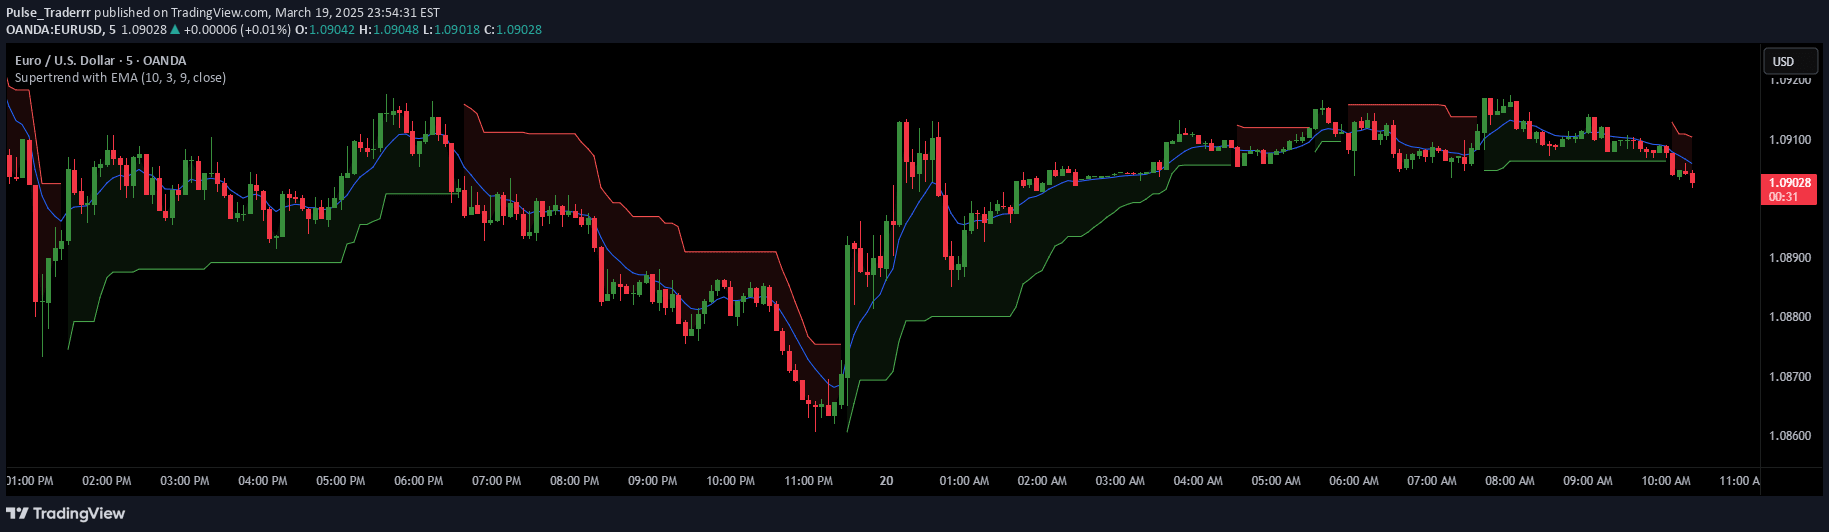
A comprehensive trading indicator that combines pivot points, Supertrend, EMAs, and support/resistance levels to provide trend analysis and potential trade signals across multiple market conditions.
Explore complementary indicator rolesHow it works
The Pivot Point Supertrend indicator integrates multiple technical analysis components to generate comprehensive market insights. It calculates pivot points using selected price sources, creating support and resistance zones that help traders identify potential price reversal points.
The indicator simultaneously tracks Supertrend using Average True Range, plots multiple Exponential Moving Averages, and marks key support/resistance levels. By combining these elements, the system provides a multi-layered approach to trend identification, dynamically updating visual cues that represent market momentum and potential trading opportunities.
Why it may be useful
This integrated indicator offers traders a holistic view of market dynamics by consolidating multiple analytical tools into a single, powerful framework. It eliminates the need to switch between different indicators, providing a comprehensive snapshot of trend direction, momentum, and potential entry/exit points.
By synthesizing pivot points, Supertrend, EMAs, and support/resistance levels, traders gain enhanced decision-making capabilities. The indicator's versatility allows for improved risk management, more accurate trend detection, and a deeper understanding of market structure across various timeframes and trading styles.
When to explore it
The Pivot Point Supertrend indicator is most effective in markets with clear trending characteristics, such as forex, stocks, and cryptocurrencies. It performs exceptionally well during periods of sustained directional movement, helping traders identify and capitalize on emerging trends with greater precision.
Traders should utilize this indicator during market sessions with consistent volatility and when seeking a comprehensive analytical tool that combines multiple technical perspectives. It is particularly valuable for traders who want a nuanced understanding of market dynamics and seek to make informed trading decisions based on multiple technical signals.
Keep exploring
What we’ve verified
Access, alerts and repainting behaviour have not been independently verified for this indicator. Check the creator’s current publication and settings.
General descriptions and classifications are recovered research. Verified details above identify the specific checks we have completed. Check the creator’s current publication for later changes.