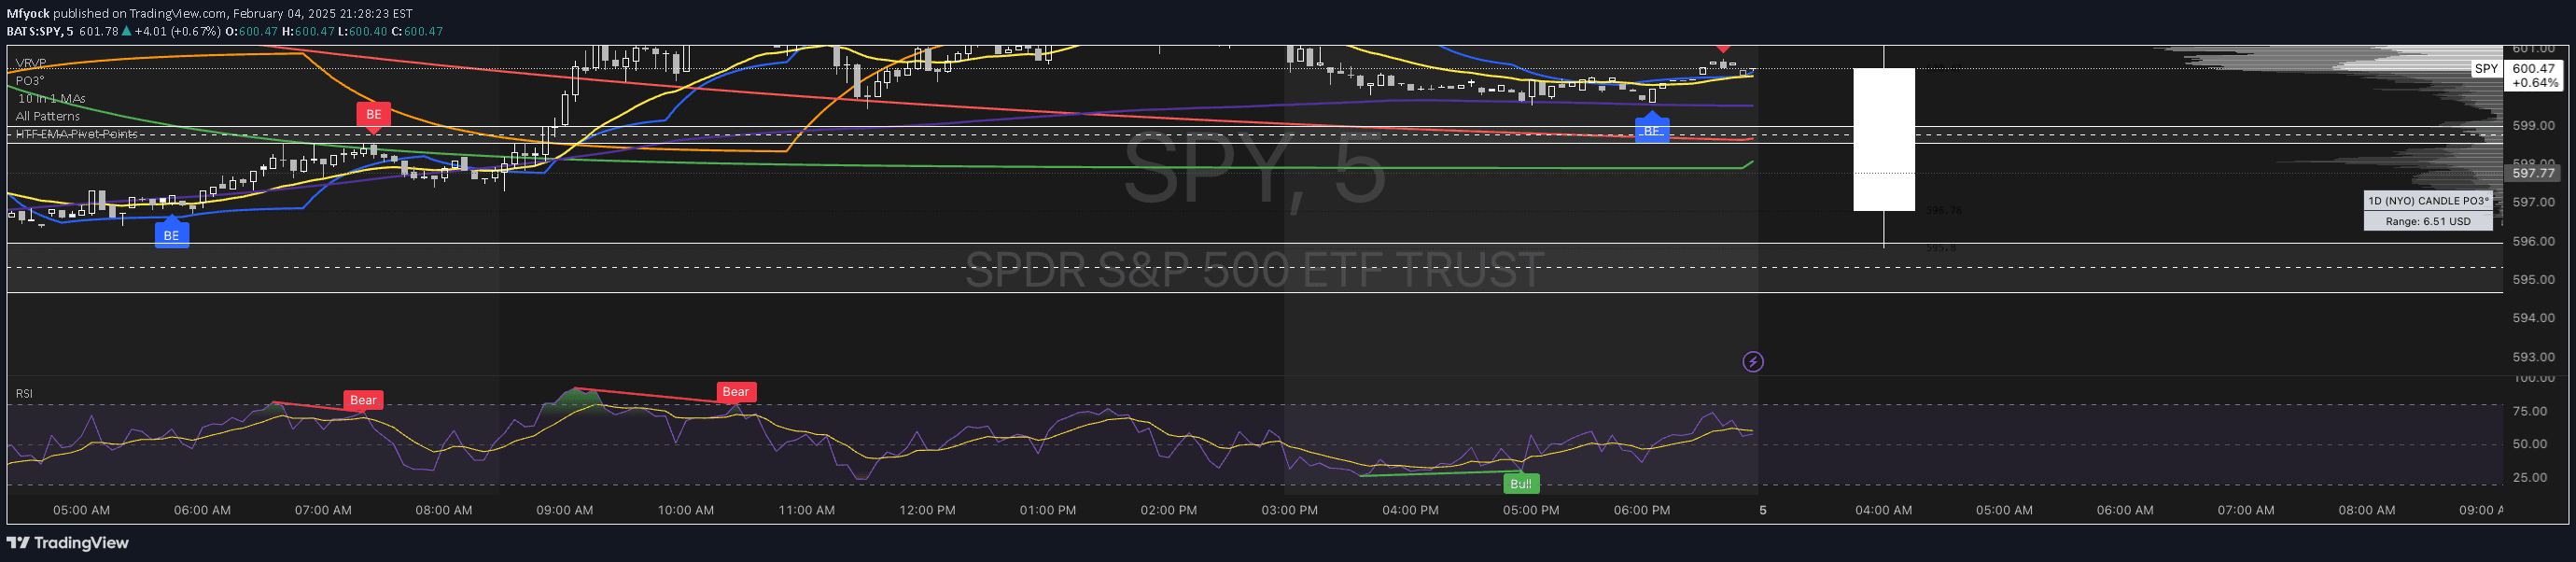
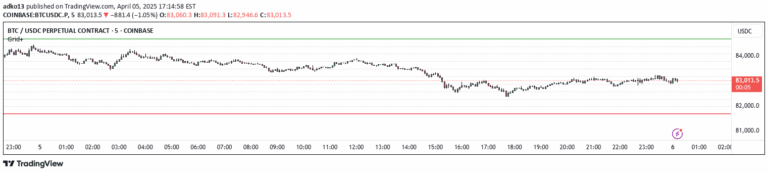
A dynamic pivot indicator that estimates monthly pivot levels in real-time using current high, low, and close prices, helping traders anticipate potential support and resistance zones.
Explore complementary indicator rolesHow it works
The KJS Ghost Pivot Moving Average calculates a dynamic pivot point by combining the current month's high and low from regular trading hours with the current candle's close price. It uses a simple averaging method to determine the pivot level, taking the average of the monthly high, low, and current close (HLC3).
The indicator then applies a customizable simple moving average (SMA) to smooth the pivot point, allowing for more stable and refined tracking of potential support and resistance levels. By incorporating both regular trading hours data and extended hours closing prices, the indicator provides a comprehensive view of potential monthly pivot dynamics.
Why it may be useful
Traders benefit from this indicator because it offers a real-time estimation of potential monthly pivot levels, which can serve as critical decision-making points for entries, exits, and overall market strategy. By visualizing dynamic support and resistance zones, traders can make more informed decisions about potential price movements and market sentiment.
The smoothing mechanism of the SMA helps reduce market noise and provides a more stable interpretation of pivot points, allowing traders to focus on significant price levels without getting distracted by minor fluctuations. This makes the indicator valuable across different trading styles and timeframes.
When to explore it
The KJS Ghost Pivot Moving Average is most effective in markets with clear monthly trends and consistent price action. It works particularly well in liquid markets like major stock indices, forex pairs, and actively traded commodities where monthly pivot levels tend to have significant predictive value.
Traders should consider using this indicator during periods of market consolidation or when seeking to identify potential trend reversals. It is especially useful when combined with other technical analysis tools to confirm signals and improve overall trading decision-making.
Keep exploring
What we’ve verified
Access, alerts and repainting behaviour have not been independently verified for this indicator. Check the creator’s current publication and settings.
General descriptions and classifications are recovered research. Verified details above identify the specific checks we have completed. Check the creator’s current publication for later changes.