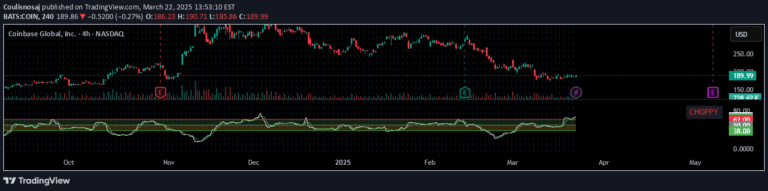
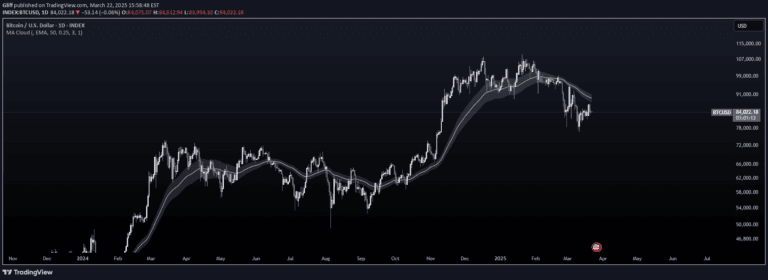
A composite EMA indicator that compares an asset's closing price with the XU100 index, scaling EMA values to provide unique market trend and support/resistance insights.
Explore complementary indicator rolesHow it works
The indicator first retrieves the daily closing prices of the current trading asset and the XU100 index, calculating a ratio between these two values. By using this ratio, it computes Exponential Moving Averages (EMAs) across multiple timeframes, specifically 34, 55, and 233 periods.
These EMA values are then scaled by multiplying them with the XU100 index's closing price, effectively transforming the ratios into meaningful price levels. The script uses line.new() to draw horizontal lines representing these scaled EMA values, providing a visual representation of potential market trends and key support/resistance levels.
Why it may be useful
This indicator offers traders a unique perspective by comparing an individual asset's performance against a broader market index, providing insights that go beyond traditional price analysis. By creating a composite view, traders can understand how their specific asset moves in relation to the overall market, which can help identify potential divergences or alignments.
The scaled EMA levels serve as dynamic reference points that adapt to changing market conditions, helping traders make more informed decisions about market trends, potential entry and exit points, and overall market sentiment. This approach combines trend analysis with relative market performance, offering a more comprehensive trading tool.
When to explore it
The Composite Scaled EMA Levels indicator is most effective in markets with clear trending characteristics and when traders want to understand an asset's performance relative to a broader market index. It works particularly well in markets like the Turkish stock market, where the XU100 index provides a comprehensive market benchmark.
Traders should use this indicator during periods of stable market conditions and when looking to identify potential support and resistance levels that are contextualized by the broader market performance. It is especially useful for day and swing traders who want a nuanced view of market trends beyond traditional price-based indicators.
Keep exploring
What we’ve verified
Access, alerts and repainting behaviour have not been independently verified for this indicator. Check the creator’s current publication and settings.
General descriptions and classifications are recovered research. Verified details above identify the specific checks we have completed. Check the creator’s current publication for later changes.