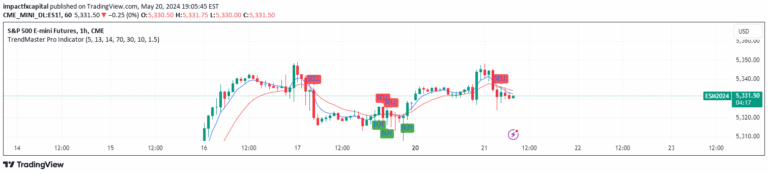
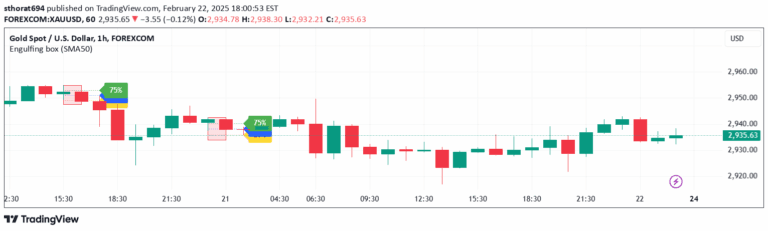
An advanced price action indicator that identifies potential market reversals and momentum shifts by detecting order blocks and confirming breaks of structure using dynamic ATR filters.
Explore complementary indicator rolesHow it works
The Order Block with Break of Structure (BoS) indicator analyzes price action by identifying specific candle structures that represent potential institutional order zones. It scans historical price data to detect bullish and bearish order blocks, which are areas where significant market participants have likely placed large orders.
Once order blocks are identified, the indicator uses a Break of Structure (BoS) confirmation mechanism to validate potential trend continuations or reversals. By incorporating a 14-period Average True Range (ATR) filter, the system ensures that only significant price movements are highlighted, effectively filtering out weak or insignificant breakouts.
Why it may be useful
This indicator provides traders with a sophisticated method to understand market dynamics from an institutional perspective, revealing potential areas of supply and demand. By visualizing order blocks and structural breaks, traders can gain insights into potential price reversal zones and momentum shifts that might not be apparent through traditional technical analysis.
The dynamic ATR filter adds an additional layer of confirmation, helping traders distinguish between meaningful market movements and random price fluctuations. This approach allows traders to make more informed decisions by aligning their strategies with potential smart money order flow and institutional trading patterns.
When to explore it
The Order Block with BoS indicator is most effective in markets with clear trending characteristics, such as forex, futures, and major stock indices. It works best on timeframes ranging from 5-minute to daily charts, where institutional order flow and market structure are more discernible and significant.
Traders should utilize this indicator during periods of established market trends, particularly when looking to identify potential entry and exit points aligned with institutional trading patterns. It is particularly useful in volatile market conditions where price action and structural breaks can provide critical insights into potential trend continuations or reversals.
Keep exploring
What we’ve verified
Access, alerts and repainting behaviour have not been independently verified for this indicator. Check the creator’s current publication and settings.
General descriptions and classifications are recovered research. Verified details above identify the specific checks we have completed. Check the creator’s current publication for later changes.