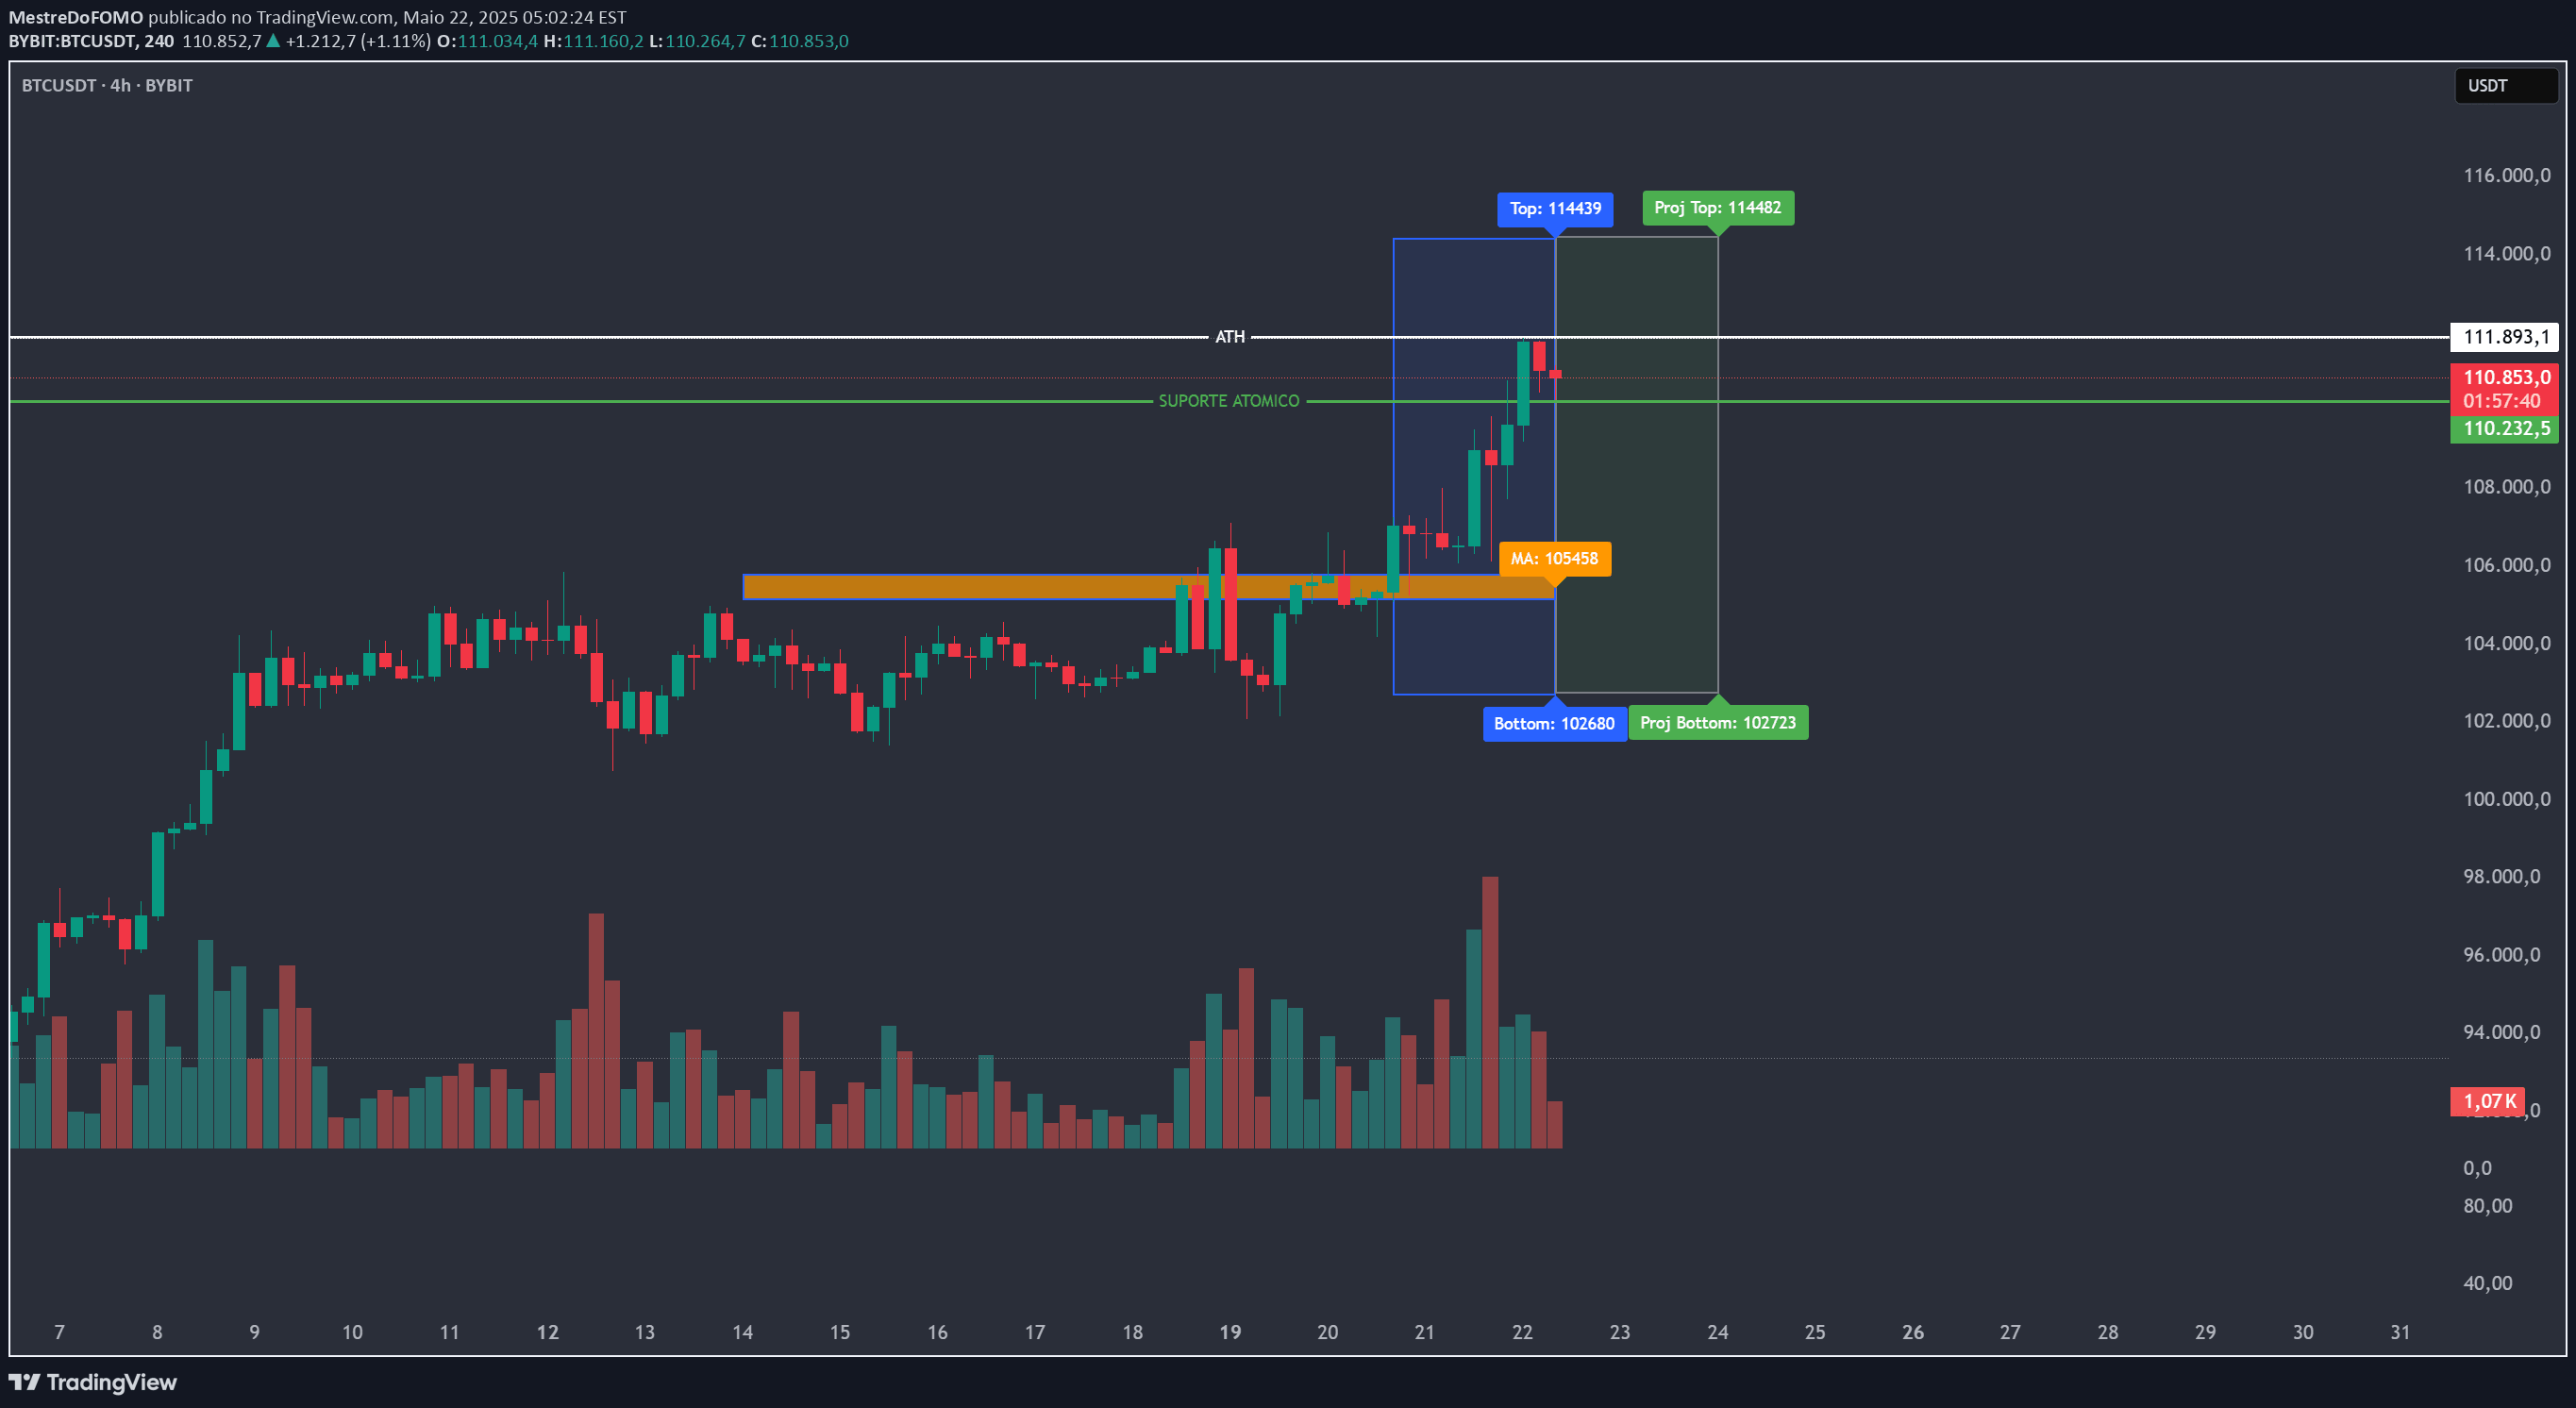
A grid-based indicator that plots horizontal price levels with customizable spacing and increments across different market types, helping traders identify key support and resistance zones.
Explore complementary indicator rolesHow it works
The Grid Extension indicator works by creating a series of horizontal price levels based on a user-defined anchor price and a selected tick increment. Traders can choose between different market types like Crypto, Forex, or Futures, which determines the appropriate tick increment range. The indicator allows customization of up to 22 grid levels, with options to show or hide specific levels, set custom values, and choose individual colors.
The grid levels are plotted dynamically around the anchor price, with configurable spacing that can be adjusted to match the specific characteristics of the traded asset. Users can extend lines to the right, display price and level labels, and control the visual presentation through settings like label position and background transparency.
Why it may be useful
The Grid Extension provides traders with a flexible visual tool for identifying and tracking potential support and resistance zones across different market types. By offering granular control over price levels, the indicator helps traders develop more precise entry and exit strategies based on key price points. Its adaptability allows for application in various trading styles and market conditions.
The indicator's customization options enable traders to create personalized price grids that align with their specific trading approach, whether they are scalping, day trading, or swing trading. By visualizing potential price zones and levels, traders can make more informed decisions about market movement and potential trading opportunities.
When to explore it
The Grid Extension works best in markets with clear price trends or defined ranges, where identifying support and resistance levels can provide valuable trading insights. It is particularly useful for traders looking to develop structured approaches to market entry and exit points across different asset types. The indicator's flexibility makes it suitable for various trading strategies and timeframes.
Traders should consider using this tool when they want to establish a systematic approach to tracking price levels, especially in volatile or range-bound markets. It is most effective when combined with other technical indicators like moving averages, and when the tick increment is carefully selected to match the specific characteristics of the traded asset.
Keep exploring
What we’ve verified
Access, alerts and repainting behaviour have not been independently verified for this indicator. Check the creator’s current publication and settings.
General descriptions and classifications are recovered research. Verified details above identify the specific checks we have completed. Check the creator’s current publication for later changes.