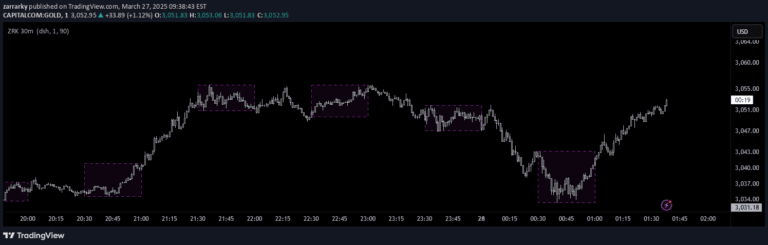
A trading indicator that identifies market range and potential breakout zones by analyzing historical price levels during a specific time period and market session.
Explore complementary indicator rolesHow it works
This signal works by looking back a specified number of historical candles at a predetermined time, such as the New York market open. It calculates the highest and lowest price points within that historical range to establish key market levels. The indicator then draws two horizontal lines representing these extreme points and creates a visual box zone to highlight the range.
By using a configurable lookback period, traders can customize the analysis to suit their specific market and trading style. The script allows users to input their time zone and select the exact time of analysis, providing flexibility in identifying potential breakout or reversal zones.
Why it may be useful
This signal is crucial for traders seeking to understand market dynamics and identify potential trading opportunities based on historical price behavior. By visualizing key support and resistance levels, traders can make more informed decisions about market entry and exit points. The indicator helps traders recognize potential breakout zones and assess the likelihood of price continuation or reversal.
Understanding these range-based levels allows traders to develop more strategic trading approaches. It provides a visual representation of market structure, helping traders anticipate potential price movements and manage risk more effectively by identifying critical support and resistance zones.
When to explore it
This signal is most effective during periods of consistent market activity, particularly during major market sessions like New York or London opens. Traders can utilize this indicator when seeking clear visual representations of market ranges and potential breakout levels. It is particularly useful in markets with defined trading sessions and predictable price movements.
The signal works best for traders who prefer technical analysis approaches and want to identify potential trading opportunities based on historical price ranges. It is especially valuable for day traders and scalpers looking to make quick, informed decisions about market entry and exit points within a specific time frame.
Keep exploring
What we’ve verified
Access, alerts and repainting behaviour have not been independently verified for this indicator. Check the creator’s current publication and settings.
General descriptions and classifications are recovered research. Verified details above identify the specific checks we have completed. Check the creator’s current publication for later changes.