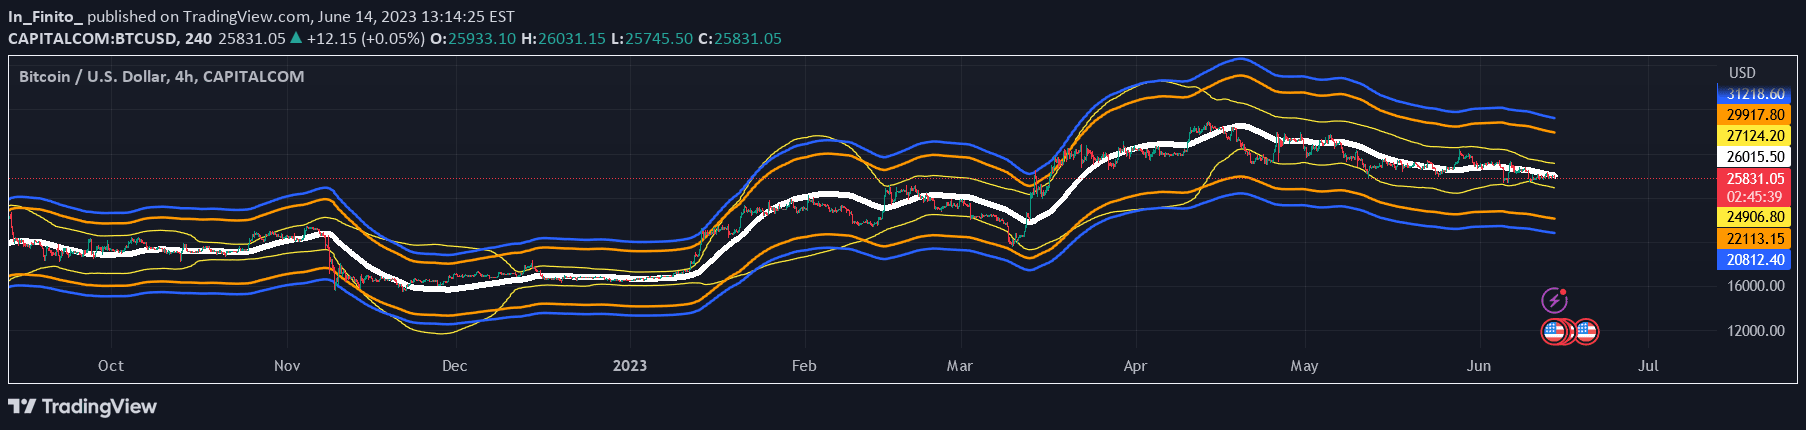
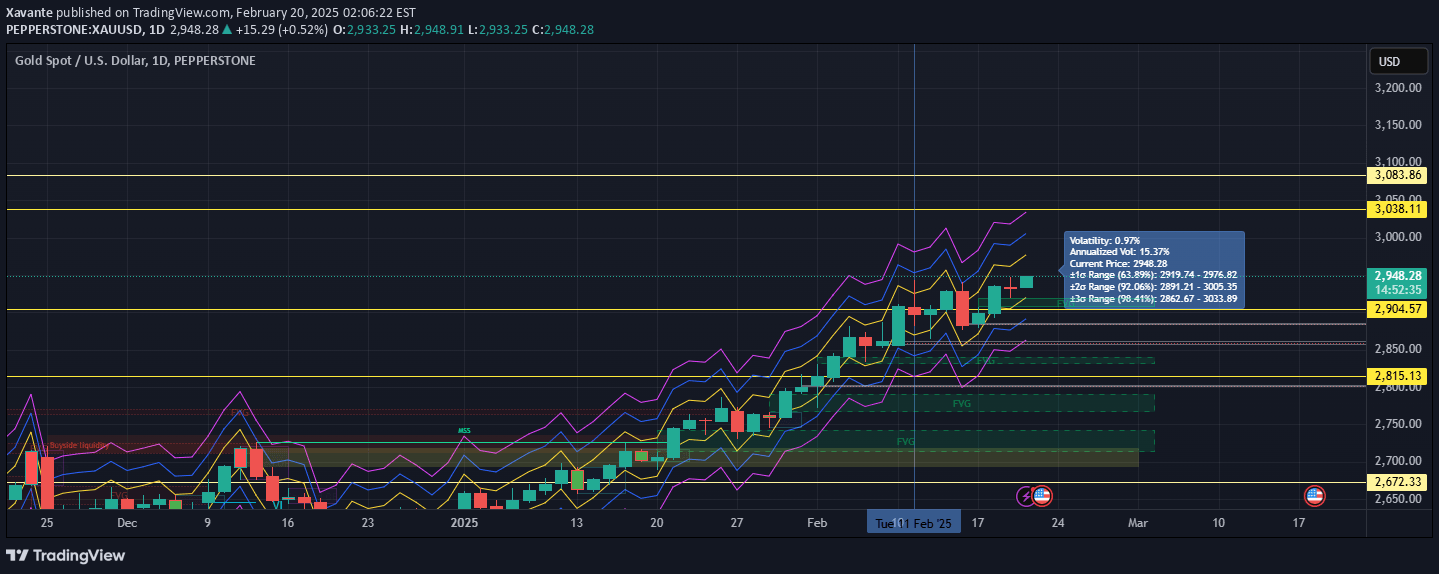
Advanced Bollinger Bands strategy using dual-length periods to analyze market volatility and identify potential trend breakouts with color-coded visual signals.
Explore complementary indicator rolesHow it works
The indicator uses two Bollinger Band lengths - a 20-period short-term and a 200-period long-term band - to analyze price volatility and market dynamics. The system calculates these bands using standard deviation around a simple moving average, creating upper and lower boundary lines that expand and contract with market volatility.
By overlaying these two Bollinger Bands, traders can simultaneously assess short-term price movements and long-term trend context. The script color-codes candles based on price positioning relative to the 200-period bands: green for bullish breakouts above the upper band, red for bearish breakouts below the lower band, and gray for neutral market conditions.
Why it may be useful
This multi-timeframe Bollinger Bands approach provides traders with a comprehensive view of market volatility and potential trend shifts. By integrating short-term and long-term perspectives, traders can make more informed decisions about market entry and exit points, reducing the risk of trading against the broader market trend.
The color-coded visualization simplifies complex market analysis, allowing traders to quickly interpret market sentiment and potential breakout opportunities. This approach bridges the gap between technical complexity and visual simplicity, making advanced market analysis more accessible to traders of different skill levels.
When to explore it
The indicator is most effective in markets experiencing significant volatility or during potential trend transition periods. It works particularly well in trending markets where clear directional movements can be identified through the Bollinger Bands' expansion and contraction.
Traders should apply this strategy in liquid markets with sufficient price movement, such as major stock indices, forex pairs, and actively traded commodities. It is especially useful when combined with other confirmation indicators to validate potential trade signals and reduce false breakout risks.
Keep exploring
What we’ve verified
Access, alerts and repainting behaviour have not been independently verified for this indicator. Check the creator’s current publication and settings.
General descriptions and classifications are recovered research. Verified details above identify the specific checks we have completed. Check the creator’s current publication for later changes.