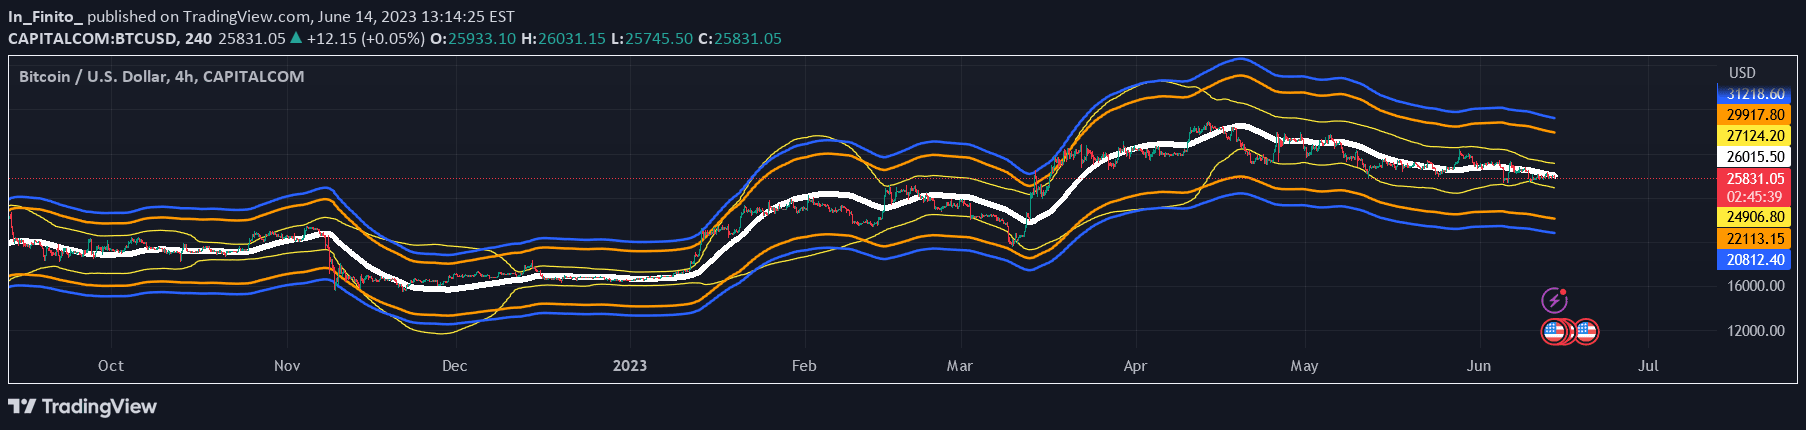
Bollinger Bands indicator that quantifies trend strength through numeric values representing band slope angles, providing visual and numerical trend analysis.
Explore complementary indicator rolesHow it works
Bollinger Bands measure price volatility by creating dynamic upper and lower bands around a moving average centerline. These bands expand and contract based on market price fluctuations, tracking price movements with mathematical precision.
The numeric angle measurements provide traders with quantitative insights into band slope strength. By displaying numerical values in different chart corners, traders can quickly assess trend momentum and potential directional changes without solely relying on visual band width interpretations.
Why it may be useful
Bollinger Bands help traders understand market volatility and potential price movement directions through visual and numeric representations. These bands offer a comprehensive view of market dynamics, revealing potential trend strengths and possible reversal points.
By providing both visual and numeric trend measurements, traders can make more informed decisions about market entry and exit points. The numeric angle measurements offer an objective perspective on trend momentum, reducing subjective interpretation and enhancing trading strategy precision.
When to explore it
Bollinger Bands are most effective during trending markets with clear directional movements, helping traders identify potential breakout or breakdown scenarios. They work exceptionally well in markets experiencing moderate to high volatility, where price movements are significant enough to create meaningful band expansions.
Traders should utilize these bands during periods of consolidation and transition, as the numeric angle measurements can signal emerging trends before they become visually apparent. They are particularly useful in forex, stock, and cryptocurrency markets where rapid price changes are common.
Keep exploring
What we’ve verified
Access, alerts and repainting behaviour have not been independently verified for this indicator. Check the creator’s current publication and settings.
General descriptions and classifications are recovered research. Verified details above identify the specific checks we have completed. Check the creator’s current publication for later changes.