Live Economic Calendar by toodegrees
Live Economic Calendar tracks global financial news events, providing real-time updates on market-moving events across multiple currencies with impact levels and detailed visualizations.
Explore 11,183 indicators. Filter beyond the obvious.
Discover the tools that fit the way you trade.
11,183 tools to explore
Live Economic Calendar tracks global financial news events, providing real-time updates on market-moving events across multiple currencies with impact levels and detailed visualizations.
A price action indicator that detects liquidity sweeps by identifying key swing points and tracking price movements through critical liquidity levels without complex numerical settings.
A pure price action indicator that detects order blocks and breaker blocks, identifying significant trading zones based on market structure and price movement patterns.
A sophisticated trading indicator using Bayesian probability theory and multiple moving averages to assess market trends and predict potential price direction with statistical precision.
A multi-symbol scanner that tracks price movements against previous day, week, and month highs and lows, providing visual and alert-based tracking of key market levels.
A volume delta indicator that visually displays trading volume distribution across price levels using configurable display modes and color-coded volume blocks.
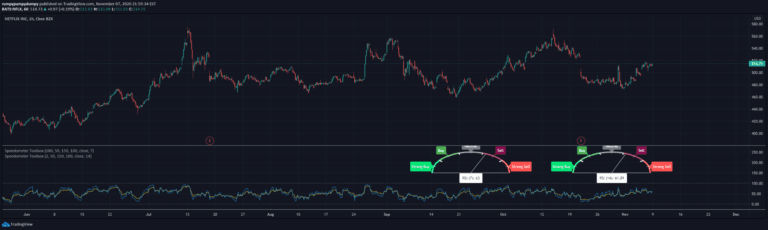
Custom metric speedometers provide specialized visualization techniques for tracking and representing performance indicators through graphical gauge-like representations.
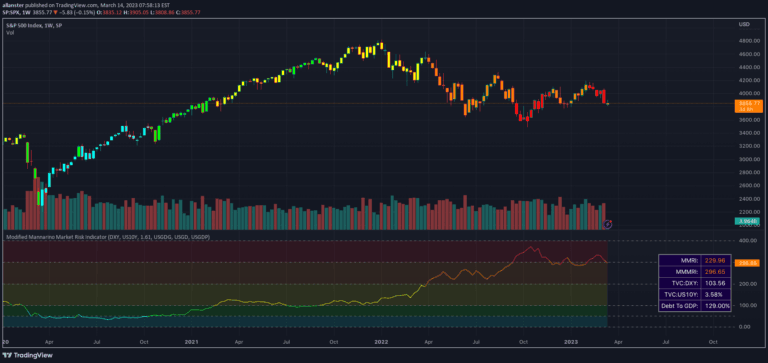
The Modified Mannarino Market Risk Indicator (MMMRI) evaluates market risk by analyzing debt, USD strength, and interest rates to provide a comprehensive risk assessment tool for traders.
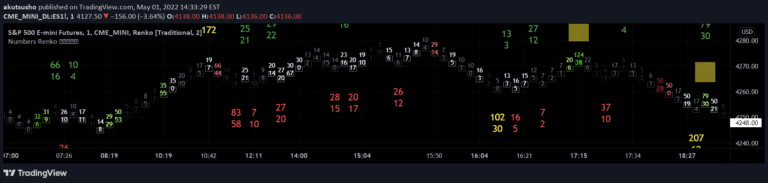
A Renko chart indicator that displays volume and time metrics within chart boxes, utilizing Wyckoff method principles to provide visual trading insights through color-coded numerical representations.
An improved McGinley Dynamic indicator that addresses computational limitations by implementing constraints to prevent extreme calculations and provide more stable trend analysis.
A data visualization tool that helps traders analyze the distribution of numerical data by dividing it into bins and calculating the percentage of data points in each range.
An advanced trading indicator using Gaussian Moving Average with adaptive volatility and a for-loop scoring mechanism to detect dynamic market trends and potential signal opportunities.
Likes, views, and comments are historical TradingView snapshots. They describe attention, not trading performance.