OBV Traffic Lights
On-balance volume (OBV) indicator that tracks volume and price relationship using Heikin Ashi candles and traffic light moving averages to identify trend shifts and volume dynamics.
Explore 11,183 indicators. Filter beyond the obvious.
Discover the tools that fit the way you trade.
11,183 tools to explore
On-balance volume (OBV) indicator that tracks volume and price relationship using Heikin Ashi candles and traffic light moving averages to identify trend shifts and volume dynamics.
A data visualization tool that helps traders analyze the distribution of numerical data by dividing it into bins and calculating the percentage of data points in each range.
The Mean Deviation Index (MDX) measures price deviation from a mean using standard deviation of ATR, visually indicating when price moves beyond a specified threshold.
An advanced indicator that uses choppiness index and ATR standard deviation to dynamically detect market trends and ranges, providing color-coded bar signals for traders.
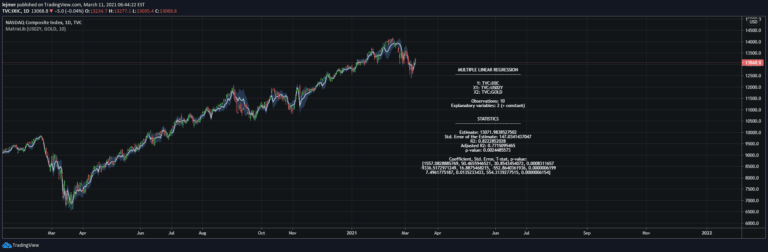
A comprehensive matrix math library for Pine Script that enables advanced mathematical operations, multiple linear regression, and solving complex linear equation systems for trading analysis.
A pseudo-random asset data generator that creates simulated price and volume data with customizable parameters for testing and research purposes.
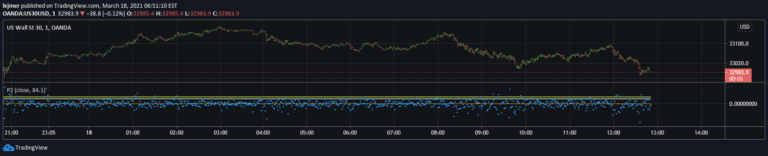
A statistical method for estimating percentiles in financial data series using the P-Square algorithm, which provides a fast and accurate approach to understanding data distribution and variability.
Likes, views, and comments are historical TradingView snapshots. They describe attention, not trading performance.