
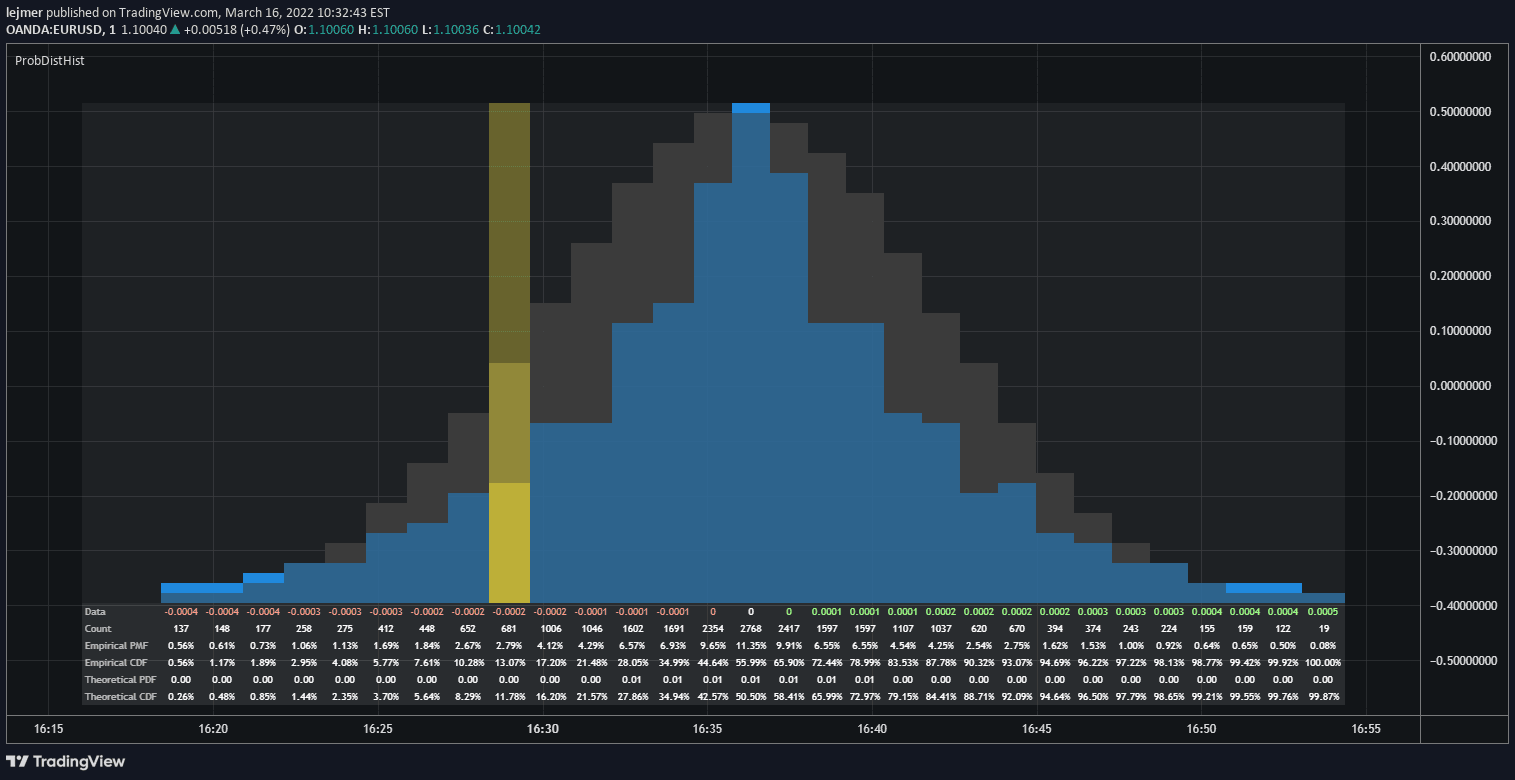
A data visualization tool that helps traders analyze the distribution of numerical data by dividing it into bins and calculating the percentage of data points in each range.
Explore complementary indicator rolesHow it works
The probability distribution histogram first determines the minimum and maximum values of a dataset to establish its range. It then divides this range into a specified number of bins, with each bin representing a specific interval.
As data points are placed into their corresponding bins, the indicator calculates the percentage of total data points in each bin. This process allows traders to visually understand how data is spread across different value ranges, helping to identify patterns, clusters, and potential outliers in the dataset
Why it may be useful
The probability distribution histogram is crucial for traders because it provides a visual representation of data distribution, allowing for deeper insights into market behavior. By transforming data through logarithmic functions, percentage changes, or differencing, traders can uncover hidden patterns and relationships.
The ability to compare the actual distribution against a normal distribution helps identify potential anomalies or unique characteristics in the data that might not be apparent through traditional analysis methods
When to explore it
This histogram is most effective during data exploration and research phases, particularly when analyzing large datasets or complex market information. It works best when examining financial metrics like returns, price changes, trading volumes, or performance indicators.
Traders can use it to identify statistical properties of their data, detect potential outliers, understand market dynamics, and validate underlying assumptions in their trading strategies. It is especially useful for quantitative traders and researchers seeking to gain deeper statistical insights
Keep exploring
What we’ve verified
Access, alerts and repainting behaviour have not been independently verified for this indicator. Check the creator’s current publication and settings.
General descriptions and classifications are recovered research. Verified details above identify the specific checks we have completed. Check the creator’s current publication for later changes.


