RSI (Kernel Optimized) | Flux Charts
A specialized RSI indicator using Kernel Density Estimation to predict potential pivot points by analyzing historical RSI patterns and calculating probability of price reversals.
Explore 11,183 indicators. Filter beyond the obvious.
Discover the tools that fit the way you trade.
11,183 tools to explore
A specialized RSI indicator using Kernel Density Estimation to predict potential pivot points by analyzing historical RSI patterns and calculating probability of price reversals.
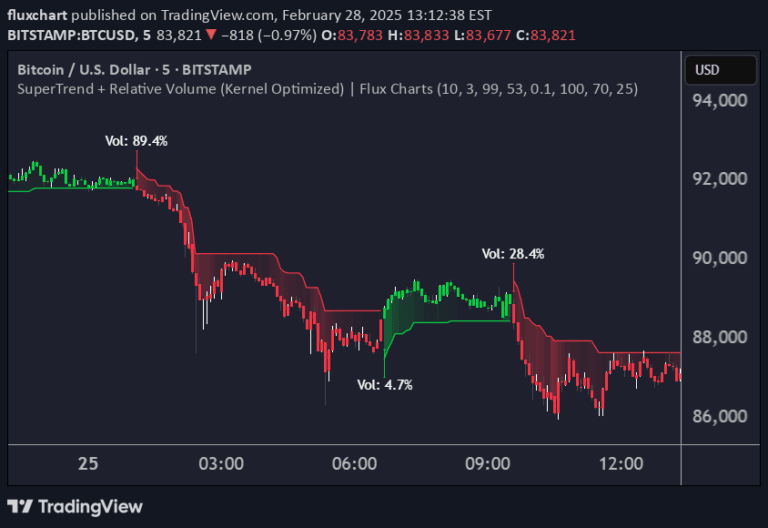
An advanced trading indicator combining Supertrend and Relative Volume using Kernel Density Estimation to predict trend breaks with probabilistic precision and volume confirmation.
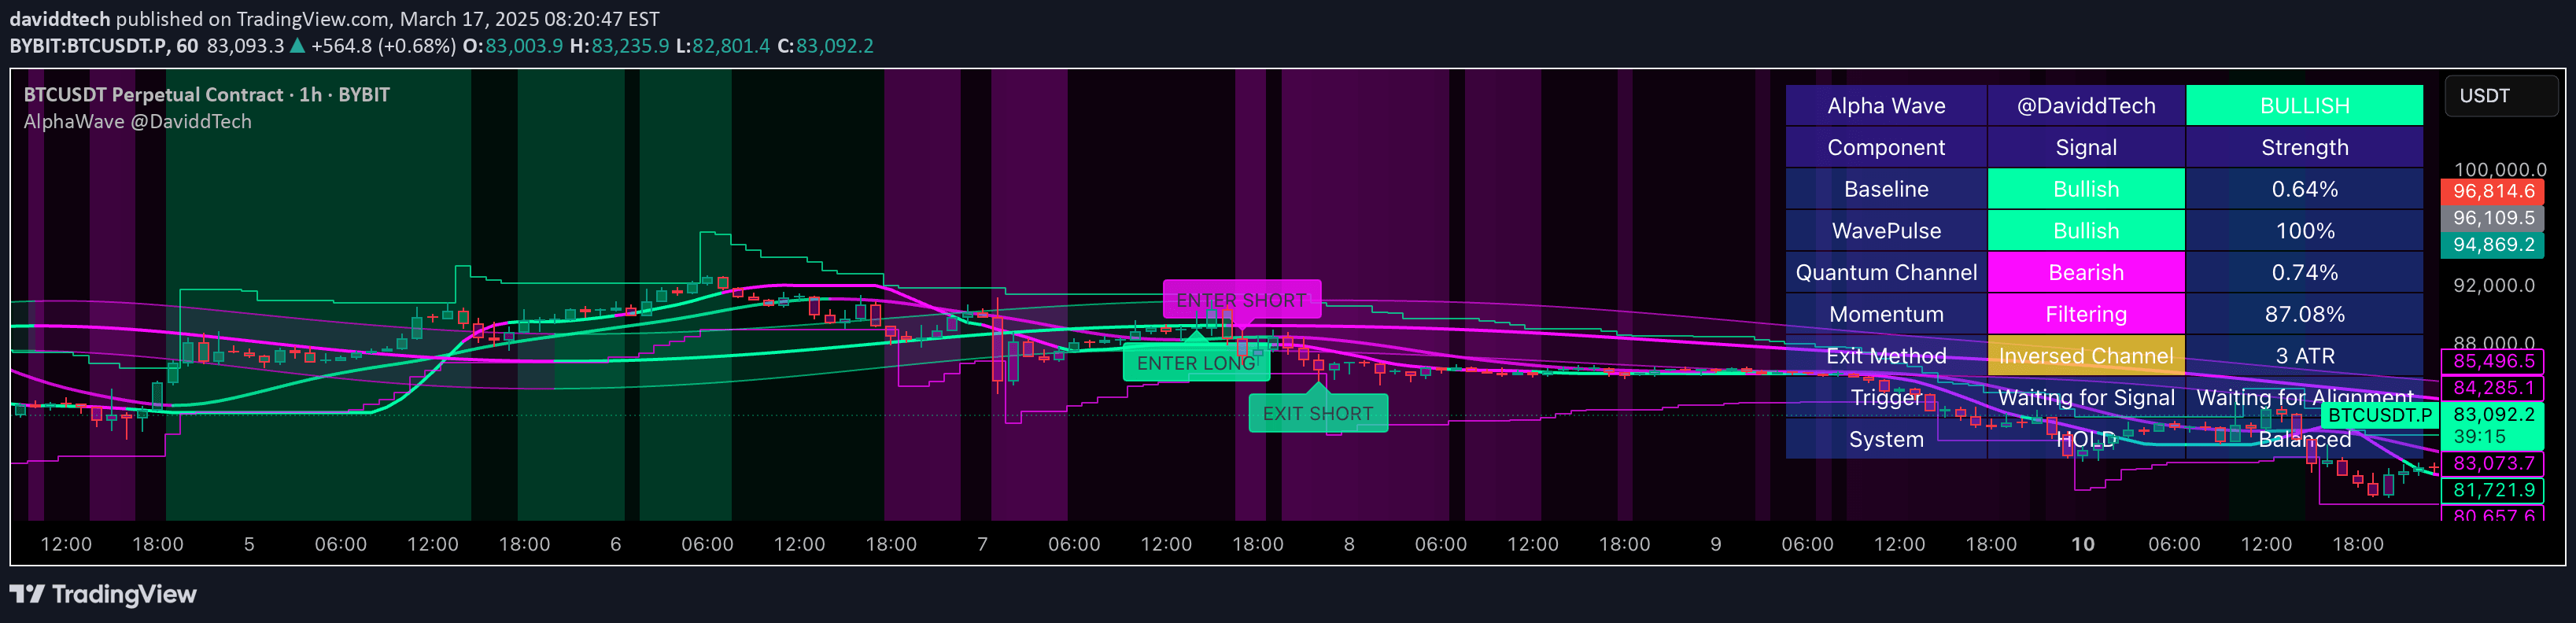
Alpha Wave is an advanced multi-component trading system that integrates adaptive moving averages, momentum indicators, and volatility filters to generate high-probability trading signals.
Dynamic volume clustering indicator that identifies key price zones with market memory, providing retest signals and insights into potential trend continuations or reversals.
A data visualization tool that helps traders analyze the distribution of numerical data by dividing it into bins and calculating the percentage of data points in each range.
A volume profile tool that measures trading volume along angled trend lines, helping traders identify demand and supply zones in trending markets with interactive customization.
A unique moving average indicator that uses Probability Density Function (PDF) weighting to create an adaptive trend-following tool with dynamic candle coloring for enhanced market analysis.
A trading signal that visually represents the current market position, offering traders a quick snapshot of their investment status and potential market direction with minimal complexity.
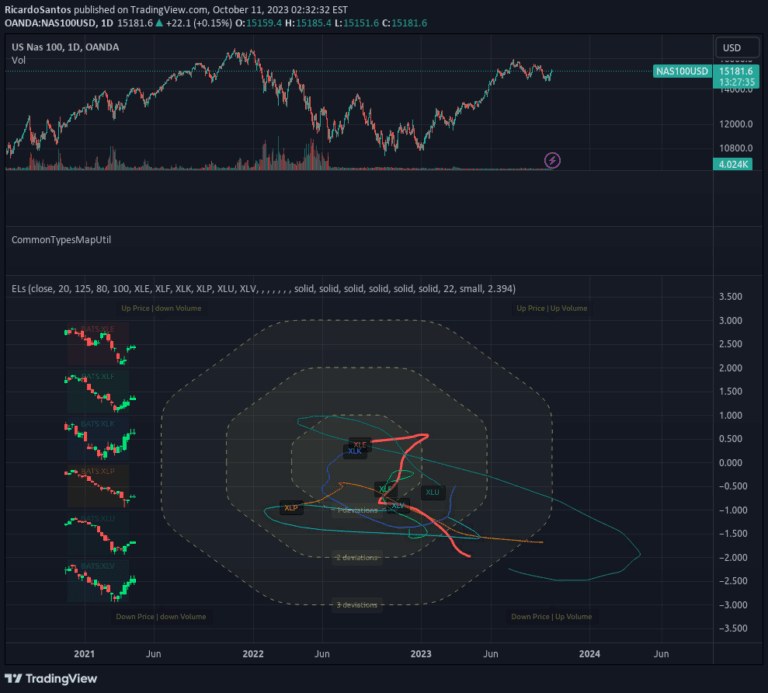
An expanded crocker graph visualization technique that tracks multiple tickers simultaneously, providing a comprehensive market overview with embedded commodity candle details.
A dynamic trading indicator combining Probability Density Function smoothing with Supertrend methodology to generate precise trend-following signals and adaptive market analysis.
A multi-layered trend indicator using smoothed moving averages that creates a density cloud to visualize market momentum and potential reversals through color-coded bars and triangles.
An advanced volume analysis tool that measures volume density across multiple assets, providing insights into market maker activities and liquidity concentration in trading markets.
Likes, views, and comments are historical TradingView snapshots. They describe attention, not trading performance.