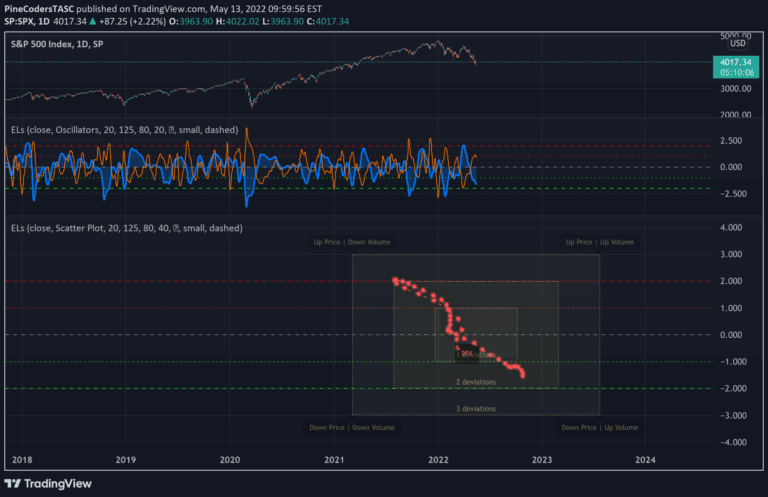
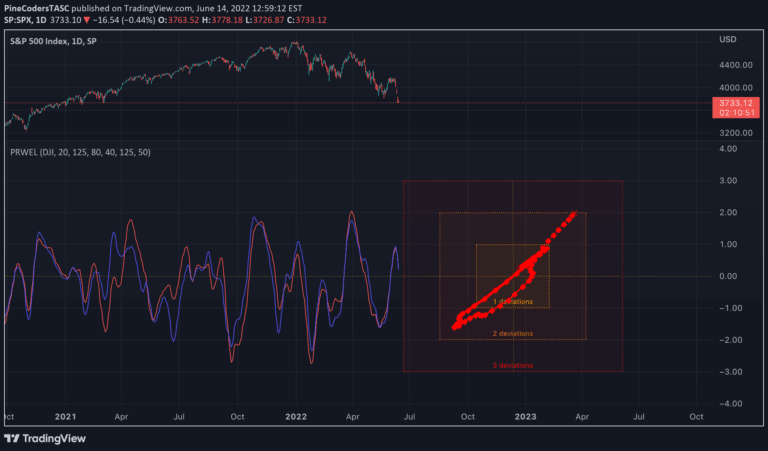
An expanded crocker graph visualization technique that tracks multiple tickers simultaneously, providing a comprehensive market overview with embedded commodity candle details.
Explore complementary indicator rolesHow it works
The crocker graph expands its traditional visualization to incorporate five different tickers, creating a multi-dimensional view of market performance. By displaying these tickers side by side, traders can quickly compare and analyze relative market movements.
The graph uses color-coded or standardized representations to highlight each ticker's performance. For commodity tracking, an additional side box is integrated to show current ticker candle details, enhancing the information density. This approach allows for rapid visual comprehension of market trends and potential correlations between different securities
Why it may be useful
Multi-ticker visualization provides traders with a holistic market perspective, enabling faster comparative analysis and trend identification. By presenting multiple securities simultaneously, traders can spot interconnected market movements and potential sector-wide trends.
The embedded commodity candle details offer immediate access to critical price action information. This comprehensive approach reduces the time needed to switch between different charts and facilitates more informed decision-making. Traders can quickly assess relative performance, identify potential opportunities, and understand broader market dynamics
When to explore it
This visualization technique is most effective during complex market conditions with multiple interconnected securities. It works best for traders seeking to understand cross-market relationships and sector-wide trends. Ideal for portfolio managers, swing traders, and investors monitoring multiple assets simultaneously.
Particularly useful during volatile market periods when quick, comprehensive market assessment is crucial. Works well for analyzing commodities, stocks, and related financial instruments. Provides significant value when tracking correlated markets or investigating potential systemic market movements
Keep exploring
What we’ve verified
Access, alerts and repainting behaviour have not been independently verified for this indicator. Check the creator’s current publication and settings.
General descriptions and classifications are recovered research. Verified details above identify the specific checks we have completed. Check the creator’s current publication for later changes.