Support Resistance MTF
A multi-timeframe support and resistance indicator that helps traders identify key price levels by analyzing market data across different time frames and customizable settings.
Explore 11,183 indicators. Filter beyond the obvious.
Discover the tools that fit the way you trade.
11,183 tools to explore
A multi-timeframe support and resistance indicator that helps traders identify key price levels by analyzing market data across different time frames and customizable settings.
An advanced stop-loss strategy that uses volume, price, and volatility to dynamically adjust stop-loss levels, helping traders manage risk by considering individual security characteristics.
A customizable Pine Script indicator that generates a mini-chart displaying the last 10 candles with detailed visual settings, providing quick insights into recent price action and market behavior.
Bullish Percent Index measures the percentage of securities on Point & Figure buy signals, providing a breadth indicator for market sentiment and potential trend reversals across multiple assets.
A MACD-based trading indicator that generates buy and sell signals by analyzing moving average crossovers, with support and resistance levels to confirm potential trade entries.
A Renko RSI tool that calculates momentum using custom Renko chart methodology, filtering price noise and focusing on significant price movements across different timeframes.
UT Bot Stochastic RSI combines Stochastic and RSI oscillators to identify market trends, momentum, and potential trade signals with an integrated ATR trailing stop.
MTF EMA Cloud is a multi-timeframe trading system using exponential moving averages to identify trend, support, and resistance levels across different timeframes.
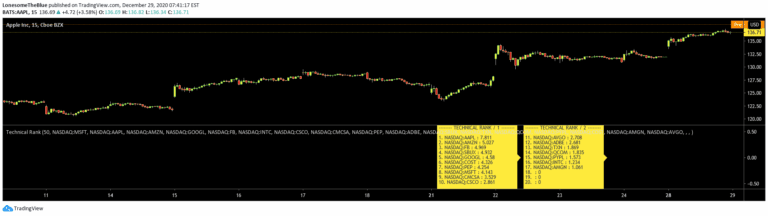
Technical Rank evaluates a security's performance by analyzing multiple indicators across long, medium, and short-term timeframes, providing a comprehensive ranking of technical strength.
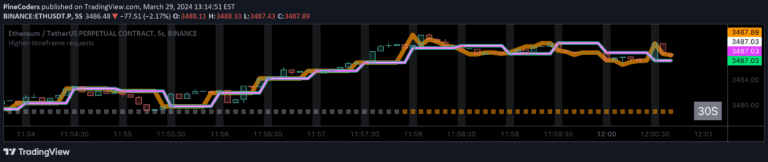
A comprehensive guide to accessing higher-timeframe data using request.security() function while preventing repainting, offering multiple non-repainting techniques for more reliable trading signals.
An advanced technical analysis script exploring the security() function in Pine Script, focusing on preventing repainting and understanding multi-timeframe data retrieval techniques.
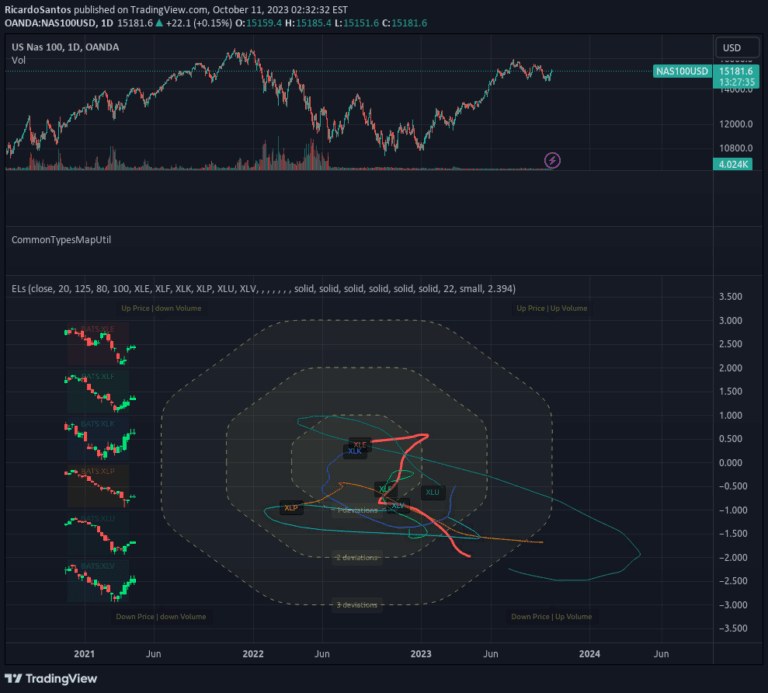
An expanded crocker graph visualization technique that tracks multiple tickers simultaneously, providing a comprehensive market overview with embedded commodity candle details.
Likes, views, and comments are historical TradingView snapshots. They describe attention, not trading performance.