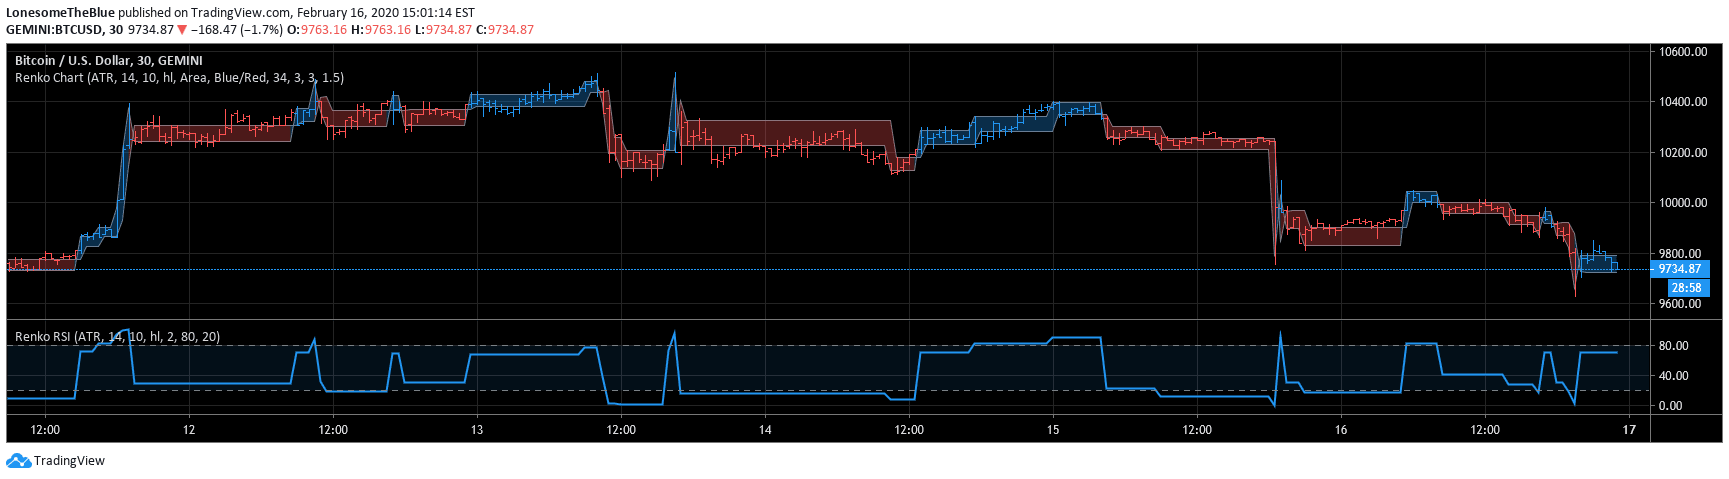
A Renko RSI tool that calculates momentum using custom Renko chart methodology, filtering price noise and focusing on significant price movements across different timeframes.
Explore complementary indicator rolesHow it works
The Renko RSI tool creates custom Renko charts that ignore time and focus solely on price changes meeting a minimum requirement. It uses a unique algorithm to calculate RSI on Renko charts, with options to use closing price or high/low as the source.
The tool can employ traditional or Average True Range (ATR) scaling methods, with an intelligent rounding algorithm that adjusts box size according to the security's minimum tick value. This approach ensures precise price movement tracking and momentum analysis
Why it may be useful
This Renko RSI tool provides traders with a more refined view of market momentum by filtering out insignificant price movements and market noise. By focusing on substantial price changes, it helps traders identify clearer support and resistance levels.
The custom RSI calculation and flexible scaling options allow for more nuanced trend analysis. The tool's built-in alerts for overbought and oversold conditions enable traders to make more informed decisions about potential market reversals and entry/exit points
When to explore it
The Renko RSI tool is most effective in markets with clear trending characteristics and significant price movements. It works best for traders seeking to minimize market noise and focus on meaningful price action.
Ideal for swing traders and day traders analyzing multiple timeframes, the tool can be particularly useful in volatile markets where traditional time-based charts might obscure important trend signals. Traders should combine this tool with other technical analysis methods for comprehensive market assessment
Keep exploring
What we’ve verified
Access, alerts and repainting behaviour have not been independently verified for this indicator. Check the creator’s current publication and settings.
General descriptions and classifications are recovered research. Verified details above identify the specific checks we have completed. Check the creator’s current publication for later changes.